
In the optimization literature, memory work is not the first thing on the list, and even if you make it to those chapters, odds are they will talk about throughput, so the system can grind through a notional five GB/s instead of three. And in general that is the right metric when you have streaming workloads or data batches like light baking, navmesh building, or shader compilation. There, what matters is how much data went through the CPU in the allotted time, and all the standard tricks (SoA, dense arrays, linear traversal, vectorization) work toward that metric.
Only in rare books will you see examples where it is not about “how much” data you processed, but about how much time passed between request and response, and the classic examples from the big world are high-frequency trading, automotive and medical systems, audio and video calls — which an ordinary programmer does not always find interesting, or which come with specifics far removed from anywhere they could be applied. All of this is also pretty far from game development, because most techniques from those examples and books do not carry over as-is, given the nature of game dev. It does not work well the other way round either, so everyone lives with their own problems, ideas and crutches.
In games, especially various strategy games, simulators and factory builders, the streaming task of pushing as much data through the cache as possible is not that pressing; instead, all sorts of latency tasks crop up, which need their data not to get kicked out of the cache whenever possible, and, when working as a group, to avoid cache cannibalism and brawls over the bus as much as they can.
Let me remind you that the frame budget is still 16ms, and in reality even less, by about 10%, because there is a serial part of the frame, buffer swaps, and a pile of non-parallelizable tasks that someone has to do anyway, and usually that someone sits at the end of the frame and does it all on a single thread.
For a VR headset it is a mere 10ms, because below 100 fps even the toughest start to sway, and the feeling of “it’s a bit choppy” turns into “ugh, I think I’m gonna throw up”. Inside those 15(9)ms live game logic, physics, animation, the scripting VM, UI, preparing render commands and submitting them to the GPU, and they all share one L3 between them.
Books, if anyone wants to dig deeper
Denis Bakhvalov, Performance Analysis and Tuning on Modern CPUs
Richard Fabian, Data‑Oriented Design
Fedor Pikus, The Art of Writing Efficient Programs
Anthony Williams, C++ Concurrency in Action
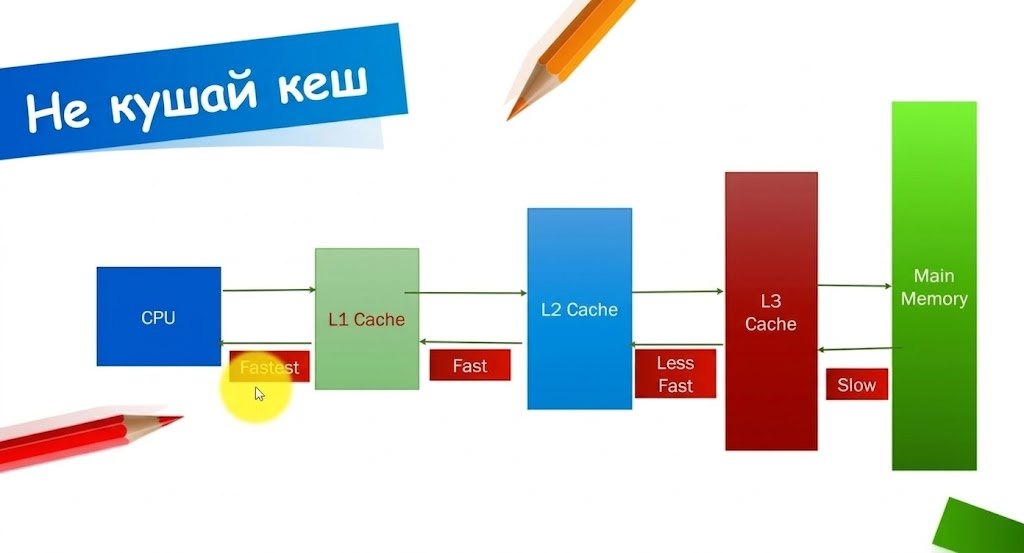
Most of you probably know cache line fetch latencies; if you don’t remember, a hit in L1 costs around four cycles, L2 is about a dozen, L3 is over forty, and a trip to main memory on desktop is hundreds of cycles, and during those cycles the CPU just stands there (virtually, as far as your task is concerned) doing nothing. For an ordinary programmer one nanosecond or two hundred makes no real difference, because they live in a world of single and double-digit milliseconds — until it turns out that some piece of logic is walking half the level asking “hey buddy, are you far from me? gimme your position, I wanna compute the distance to you”. Turns out the position sits in its own chunk of memory, every pass is a miss, and suddenly those nanoseconds have piled up to a whole millisecond and a half, even though the data seems to live in a linear array and pretty close together at that.
And that millisecond and a half is not in the profiler as a separate line; you just see that the function is called very often, those calls are smeared across the whole frame in an even layer, and the code doesn’t really look “very slow”, but something smells — the profiler honestly shows you where, but not why.
The main problem of latency-critical code is that the data we need gets evicted from the cache because it is not accessed often enough, even though it is accessed often. The first couple of examples are explanatory and not tied to the game, while the code for the examples below I took from a real project, but so as not to leak internal system names and data structures, the examples are slightly rewritten without recognizable names.
std::unordered_map<int32_t, SOrder> ActiveOrders;
while (Running)
{
    SCommand* pCommand = PollAiCommand();
    if (pCommand != nullptr)
    {
        auto Found = ActiveOrders.find(pCommand->OrderId);
        if (Found != ActiveOrders.end())
        {
            RespondToPlayer(pCommand->Origin, Found->second);
        }
    }
}
While there is no calling logic, the loop does nothing useful, and the ActiveOrders hash table drifts out of the cache, because in the meantime animation, physics, audio and texture streaming have all gone through the same cache, each pulling in its own data. And when a command finally arrives, we pay for all the misses that have piled up at once, and the player sees a freeze or an fps drop.
The same thing happens to any rarely used but must-be-fast structure, like a localization cache, the UI widget tree of a panel the player opens once a minute if you’re lucky, an “object by ID” table. They are all technically fast, but at the moment they are needed, their data is in none of the caches, and we get a longer frame time. The problem has been known for ages, and the solutions to it have been known for ages too, but they don’t always work.
Software cache warming
The most popular solution, cheap in time but expensive in electrons, is to simply not let our data out of the cache. It looks barbaric, works just as barbarically, and the first reaction, even from experienced colleagues, is usually “that’s nonsense”.
To work faster, you need to make dummy accesses to the data you want to keep in the cache — well, here we go: to read something fast, you first have to read something? Not just anything...
std::unordered_map<int32_t, SOrder> ActiveOrders;
int64_t WarmupSink = 0;
while (Running)
{
    if (HasPendingPlayerCommand())
    {
        SCommand* pCommand = PollPlayerCommand();
        if (pCommand != nullptr)
        {
            auto Found = ActiveOrders.find(pCommand->OrderId);
            if (Found != ActiveOrders.end())
            {
                RespondToPlayer(pCommand->Origin, Found->second);
            }
        }
    }
    else
    {
        const int32_t WarmupId = GetPlausibleOrderId();
        auto Found = ActiveOrders.find(WarmupId);
        WarmupSink += (Found != ActiveOrders.end()) ? 1 : 0;
    }
}
WarmupSink is here so the compiler doesn’t throw out the whole warmup as code with no side effects, and even that doesn’t always help: modern clang considers itself so smart that it throws out the warmup anyway, so you end up building crutches like dumping that value somewhere into a log or a file, just so the compiler keeps its grubby little paws off the “dead” code.
We trade a certain amount of electrons and bandwidth for predictable response time. For average fps this is bad, of course, because we took away some of the time that could have gone to something useful, like waiting on a spinlock, but for the cases when the player finds that poor unit he forgot about a few seconds ago and clicks on it — we win and get rid of the freeze.
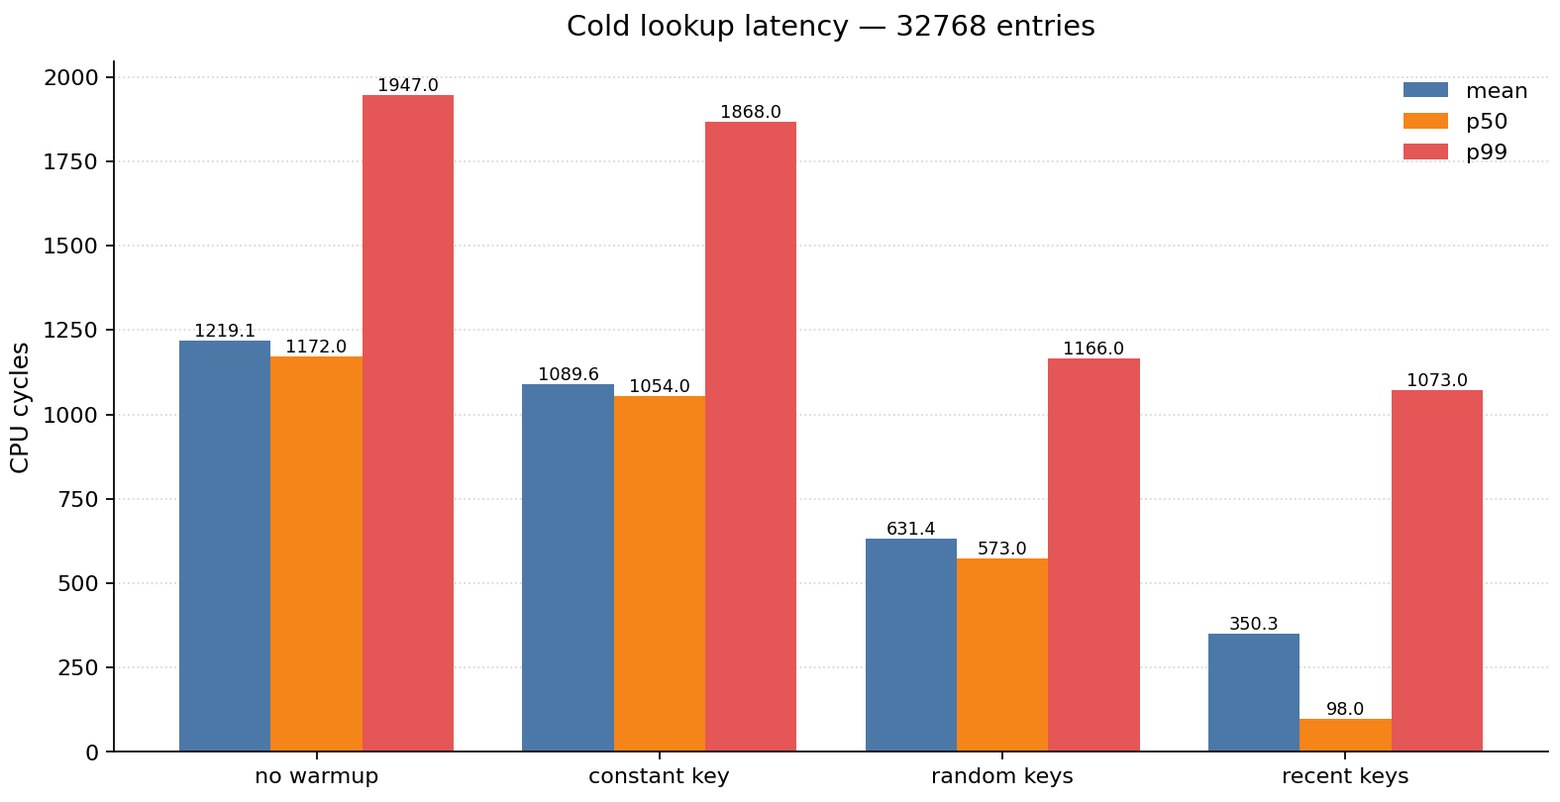
Lower is better, or how to read this chart. The chart shows the same find call on a table of 32 768 entries after deliberately pushing garbage data through the cache: left to right are four ways of warming the cache with data, the vertical axis is CPU cycles. Each strategy has three bars: mean, median (p50) and worst case (p99).
Left to right, the warmup gets smarter, and lookup time goes down. Without warmup the mean is around 1220 cycles and the worst case is 1947, i.e. the data was outside L3; with a single constant key it is almost the same. With random keys it is about twice as fast, and with recently used keys we get a several-fold reduction in lookup time.
Look at the orange and red columns (the times). With recent-key warmup the median drops to 98 cycles, i.e. most accesses (p50) hit L1 or L2. No surprise there, we are forcibly keeping the data in L1/L2, but the mean is still 350 cycles (mean), because part of the requests (p90/p99, the rare and unpopular ones) still misses the working set and drags the mean up.
p99 barely differs from random warmup, because a rare request does equally badly with random data and with history: it misses the working set in the cache and pulls data from memory.
Benchmark code
#include <random>
#include <string>
#include <unordered_map>
#include <vector>

#include "perf_common.h"

namespace NColdLatency
{
	struct STooltipInputs
	{
		uint32_t Population;
		uint32_t OwnerId;
		uint32_t MarketIndex;
		uint32_t Development;
		uint32_t Reserved[ 4 ];
	};

	enum class EWarmup
	{
		None,
		Constant,
		Random,
		History
	};

	const char* GetWarmupName( EWarmup Mode )
	{
		switch ( Mode )
		{
			case EWarmup::None: return "no warmup";
			case EWarmup::Constant: return "constant key";
			case EWarmup::Random: return "random keys";
			case EWarmup::History: return "recent keys";
		}
		return "unknown";
	}

	class CRecentRing
	{
	public:
		static constexpr int32_t RING_SIZE = 64;

		void Push( uint32_t Id )
		{
			_Ring[ _Write ] = Id;
			_Write = ( _Write + 1 ) % RING_SIZE;
		}

		uint32_t Next()
		{
			_Read = ( _Read + 1 ) % RING_SIZE;
			return _Ring[ _Read ];
		}

	private:
		uint32_t _Ring[ RING_SIZE ] = {};
		int32_t _Write = 0;
		int32_t _Read = 0;
	};

	constexpr int32_t WARMUP_LOOKUPS = 64;
	constexpr int32_t WORKING_SET_SIZE = 64;
	constexpr int32_t WORKING_SET_HIT_PERCENT = 90;

	struct SResult
	{
		NPerf::SStats Cycles;
		uint64_t Sink = 0;
	};

	SResult RunExperiment( int32_t EntryCount, EWarmup Mode, int32_t SampleCount, size_t PollutionBytesPerSample )
	{
		std::mt19937 AccessRng( 777u );
		std::mt19937 WarmupRng( 12345u );
		std::mt19937 SetupRng( 20260801u );

		std::unordered_map<uint32_t, STooltipInputs> Table;
		Table.reserve( static_cast<size_t>( EntryCount ) * 2 );
		for ( int32_t Index = 0; Index < EntryCount; ++Index )
		{
			STooltipInputs Value = {};
			Value.Population = static_cast<uint32_t>( Index ) * 37u;
			Value.OwnerId = static_cast<uint32_t>( Index ) & 255u;
			Table.emplace( static_cast<uint32_t>( Index ), Value );
		}

		std::vector<uint32_t> WorkingSet( WORKING_SET_SIZE );
		for ( uint32_t& Id : WorkingSet )
		{
			Id = SetupRng() % static_cast<uint32_t>( EntryCount );
		}

		NPerf::CCachePolluter Polluter( PollutionBytesPerSample * 4, PollutionBytesPerSample );

		CRecentRing Recent;
		for ( uint32_t Id : WorkingSet )
		{
			Recent.Push( Id );
		}

		uint64_t Sink = 0;
		std::vector<double> Samples;
		Samples.reserve( SampleCount );

		for ( int32_t Sample = 0; Sample < SampleCount; ++Sample )
		{
			const bool FromWorkingSet = ( AccessRng() % 100u ) < static_cast<uint32_t>( WORKING_SET_HIT_PERCENT );
			const uint32_t CriticalId = FromWorkingSet
				? WorkingSet[ AccessRng() % WorkingSet.size() ]
				: ( AccessRng() % static_cast<uint32_t>( EntryCount ) );

			Polluter.Pollute();

			if ( Mode != EWarmup::None )
			{
				for ( int32_t Warm = 0; Warm < WARMUP_LOOKUPS; ++Warm )
				{
					uint32_t WarmId = 0;
					if ( Mode == EWarmup::Constant )
					{
						WarmId = 0;
					}
					else if ( Mode == EWarmup::Random )
					{
						WarmId = WarmupRng() % static_cast<uint32_t>( EntryCount );
					}
					else
					{
						WarmId = Recent.Next();
					}

					const auto Found = Table.find( WarmId );
					Sink += ( Found != Table.end() ) ? Found->second.Population : 0u;
				}
			}

			const uint64_t Start = NPerf::ReadTsc();
			const auto Found = Table.find( CriticalId );
			const uint32_t Payload = ( Found != Table.end() ) ? Found->second.Population : 0u;
			const uint64_t End = NPerf::ReadTsc();

			Sink += Payload;
			Samples.push_back( static_cast<double>( End - Start ) );
			Recent.Push( CriticalId );
		}

		SResult Result;
		Result.Cycles = NPerf::ComputeStats( std::move( Samples ) );
		Result.Sink = Sink + Polluter.GetSink();
		return Result;
	}
}

int main()
{
	NPerf::PinToFirstPerformanceCore();
	const double TscHz = NPerf::CalibrateTscHz();

	printf( "Cold-access latency of a rarely used lookup table\n" );
	printf( "================================================\n\n" );
	NPerf::PrintEnvironment( TscHz );

	const int32_t SampleCount = 2000;
	const size_t PollutionBytes = 40ull * 1024 * 1024;

	printf( "Samples per variant: %d\n", SampleCount );
	printf( "Cache pollution between accesses: %zu MB of writes\n", PollutionBytes / ( 1024 * 1024 ) );
	printf( "Warmup lookups per sample: %d\n", NColdLatency::WARMUP_LOOKUPS );
	printf( "Access pattern: %d%% inside a %d-entry working set, rest uniform\n\n",
		NColdLatency::WORKING_SET_HIT_PERCENT, NColdLatency::WORKING_SET_SIZE );

	const int32_t EntryCounts[] = { 1024, 8192, 32768, 131072 };
	const NColdLatency::EWarmup Modes[] = {
		NColdLatency::EWarmup::None,
		NColdLatency::EWarmup::Constant,
		NColdLatency::EWarmup::Random,
		NColdLatency::EWarmup::History
	};

	uint64_t TotalSink = 0;
	for ( int32_t EntryCount : EntryCounts )
	{
		printf( "--- table with %d entries -------------------------------------------------\n", EntryCount );
		printf( "%-14s %10s %10s %10s %10s %10s %10s\n", "warmup", "mean", "stddev", "p50", "p90", "p99", "max" );

		for ( NColdLatency::EWarmup Mode : Modes )
		{
			const NColdLatency::SResult Result =
				NColdLatency::RunExperiment( EntryCount, Mode, SampleCount, PollutionBytes );
			TotalSink += Result.Sink;

			printf( "%-14s %10.1f %10.1f %10.1f %10.1f %10.1f %10.1f\n",
				NColdLatency::GetWarmupName( Mode ),
				Result.Cycles.Mean,
				Result.Cycles.Stddev,
				Result.Cycles.P50,
				Result.Cycles.P90,
				Result.Cycles.P99,
				Result.Cycles.Max );
		}
		printf( "\n" );
	}

	printf( "(all values in CPU cycles; %.2f cycles = 1 ns on this machine)\n", TscHz / 1e9 );
	printf( "sink = %llu\n", static_cast<unsigned long long>( TotalSink ) );
	return 0;
}
Ways to shoot yourself in the foot
Warming with random values only works if the real load is also more or less randomly spread across the structure, and in games that is almost never the case. Player commands come in bursts, often on the same object: a typical player selects a unit, clicks on it six times, then switches to another one, clicks on that, and so on.
Client packets arrive in bursts with identical IDs, and if in that situation you warm the cache with random keys, you will drag completely useless data into the cache and, surprise... evict exactly the data that was about to be used, so instead of a vaccine you get an aggravated illness. That is why you should warm not with random stuff but with what came in recently, and essentially you are hand-writing a predictor that the CPU already has — except the hardware oracle doesn’t know that the player has selected Burgundy or is browsing through his armies, but you do, and you can use that knowledge.
The second way to shoot yourself in the foot is to warm too much data: the cache is tiny compared to working sets, and there isn’t enough of it to go around. Everything you drag into it will evict something else, and that is worth remembering too, so if your data sets exceed 1MB, you either have to shrink the working set or live with longer run times with small warmup sets.
The third way to damage your feet is to warm on a different core from the one where the main computation will happen; there is no point dragging data into a cache where it isn’t needed, hopefully that needs no explanation. On top of that, remember that warming the cache during real work is also a bad idea, because it evicts recently used hot data, which all in all leaves us not that many places where warmup will actually work — separate low-priority threads, frame gaps, or moments when the player is doing something “long in time but cheap in cost”, like moving the cursor toward a button but not having clicked it yet.
Let’s continue the experiments with different table sizes, and between accesses we will flush the cache with forty megabytes of writes; the L3 on my test machine is 30 megabytes, so it is guaranteed to be flushed completely. Then we run find and see what we get, i.e. we emulate a lookup in a cold cache with prior warmup. The gist of the test: we emulate a player who occasionally clicks on units, but periodically we run an “idle” lookup with different strategies and throw its results away, just to keep the cache warm with data.
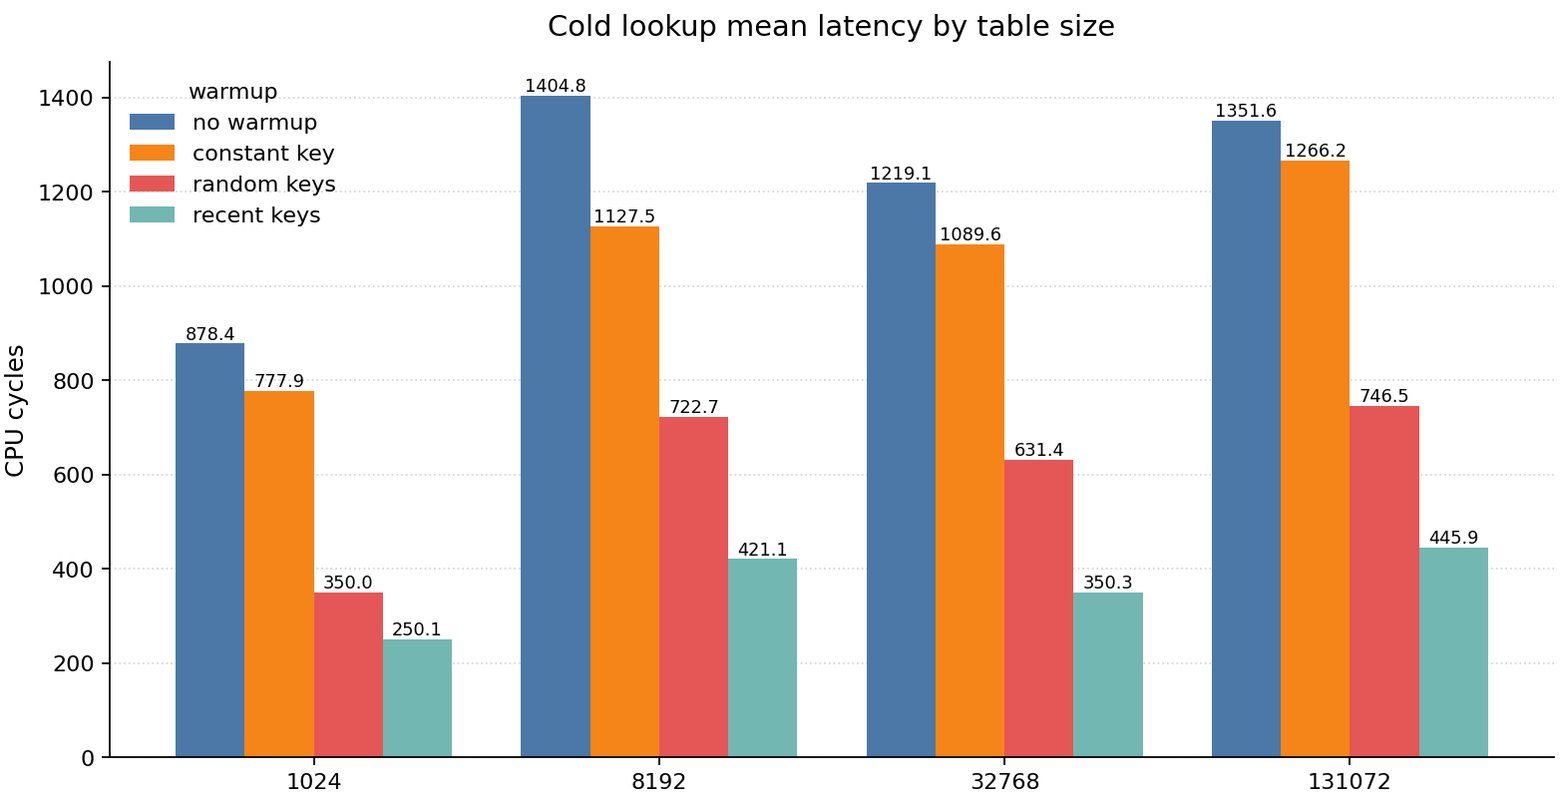
As usual, lower is better, and here is how to read this chart. The no-warmup column is our “ideal worst measurement”, i.e. we hit the table lookup only when it actually happens, but even warming with a single last key gives about ten percent, keeping the “cache” somewhat in shape. The gain is small, of course, since you keep in cache the data for only one search branch out of a possible log2(size).
Then it gets more interesting: warming with random keys already gives x2, which is explained by the random nature of the data itself, i.e. random numbers map well onto the random sample in the benchmark, so the warmup works.
Warming with recent keys gives x3.5 on the mean and over x11 on the median, which means the working set lands in L1 or L2, i.e. the data that is really needed ends up in the fastest cache. Overjoyed with these results, we rush to the tech director and merge the commit, getting -1% run time in real scenarios — well, at least it’s not a plus... that’s something.
This is not going to work
And now let me tell you why all the text above turned out to be useless in a real project. Here is what a structure that simply grew organically in the game looks like:
struct SLocation
{
    uint32_t OwnerId;
    uint32_t ControllerId;
    float    Development;
    uint16_t Population;
    uint8_t  TerrainType;
    uint8_t  Flags;
    char     DisplayName[64];
    uint8_t  History[200];
    uint8_t  Buildings[96];
};
This structure is 376 bytes; the map region traversal reads four fields from it, i.e. ten bytes, but is forced to drag all 376 into the cache, which gives us a useful cache payload of something like (10 / 376), about three percent. Take all those x2, x5, x10 from the previous part, multiply them by 3%, and you get a x1.06 gain in real calls. And here is what is actually used in the lookup:
struct SColorInputs
{
    uint32_t OwnerId;
    uint8_t  TerrainType;
    uint8_t  Flags;
    uint16_t Padding;
};
Now we fetch only the eight bytes that are actually needed for the lookup, and one 64-byte cache line fits eight locations instead of one sixth of one.
Benchmark code
#include <map>
#include <memory>
#include <numeric>
#include <random>
#include <vector>

#include <benchmark/benchmark.h>

#include "map_world.h"
#include "perf_common.h"

namespace NRecolorBench
{
	using NMapWorld::ComputeColor;
	using NMapWorld::SColorInputs;
	using NMapWorld::SLocationFat;

	struct SWorld
	{
		std::vector<SLocationFat> Fat;
		std::vector<SColorInputs> Slim;
		std::vector<uint32_t> SoaOwner;
		std::vector<uint8_t> SoaTerrain;
		std::vector<uint8_t> SoaFlags;
		std::vector<uint32_t> Palette;
		std::vector<uint32_t> ColorBuffer;
		std::vector<uint32_t> ShuffledIndices;
		std::vector<uint32_t> OrderedIndices;
		std::vector<std::unique_ptr<SColorInputs>> SlotStorage;
		std::vector<SColorInputs*> SlotPointers;
		std::vector<int32_t> HandleToSlot;
		std::vector<uint32_t> ShuffledHandles;
	};

	constexpr int32_t MAX_FAT_COUNT = 262144;

	SWorld* BuildWorld( int32_t Count, bool WithFat, bool WithScatteredSlots )
	{
		SWorld* pWorld = new SWorld();
		std::mt19937 Rng( 20260801u );

		if ( WithFat )
		{
			pWorld->Fat.resize( Count );
		}
		pWorld->Slim.resize( Count );
		pWorld->SoaOwner.resize( Count );
		pWorld->SoaTerrain.resize( Count );
		pWorld->SoaFlags.resize( Count );
		pWorld->ColorBuffer.resize( Count );

		pWorld->Palette.resize( 256 );
		for ( int32_t Index = 0; Index < 256; ++Index )
		{
			pWorld->Palette[ Index ] = Rng();
		}

		for ( int32_t Index = 0; Index < Count; ++Index )
		{
			const uint32_t Owner = Rng() & 255u;
			const uint8_t Terrain = static_cast<uint8_t>( Rng() & 15u );
			const uint8_t Flags = static_cast<uint8_t>( Rng() & 7u );

			if ( WithFat )
			{
				SLocationFat& Location = pWorld->Fat[ Index ];
				Location.OwnerId = Owner;
				Location.ControllerId = Owner;
				Location.Development = 1.0f;
				Location.Population = static_cast<uint16_t>( Index & 0xFFFF );
				Location.TerrainType = Terrain;
				Location.Flags = Flags;
				Location.DisplayName[ 0 ] = 'L';
				Location.History[ 0 ] = 1;
				Location.Buildings[ 0 ] = 1;
			}

			pWorld->Slim[ Index ].OwnerId = Owner;
			pWorld->Slim[ Index ].TerrainType = Terrain;
			pWorld->Slim[ Index ].Flags = Flags;
			pWorld->Slim[ Index ].Padding = 0;

			pWorld->SoaOwner[ Index ] = Owner;
			pWorld->SoaTerrain[ Index ] = Terrain;
			pWorld->SoaFlags[ Index ] = Flags;
		}

		pWorld->OrderedIndices.resize( Count );
		std::iota( pWorld->OrderedIndices.begin(), pWorld->OrderedIndices.end(), 0u );
		pWorld->ShuffledIndices = pWorld->OrderedIndices;
		std::shuffle( pWorld->ShuffledIndices.begin(), pWorld->ShuffledIndices.end(), Rng );

		if ( WithScatteredSlots )
		{
			pWorld->SlotStorage.reserve( Count );
			pWorld->SlotPointers.reserve( Count );
			pWorld->HandleToSlot.resize( Count );
			for ( int32_t Index = 0; Index < Count; ++Index )
			{
				auto Slot = std::make_unique<SColorInputs>( pWorld->Slim[ Index ] );
				pWorld->SlotPointers.push_back( Slot.get() );
				pWorld->SlotStorage.push_back( std::move( Slot ) );
				pWorld->HandleToSlot[ Index ] = Index;
			}
			pWorld->ShuffledHandles = pWorld->ShuffledIndices;
		}

		return pWorld;
	}

	SWorld& GetWorld( int32_t Count )
	{
		static std::map<int32_t, SWorld*> Cache;
		auto Found = Cache.find( Count );
		if ( Found == Cache.end() )
		{
			const bool HeavyExtras = Count <= MAX_FAT_COUNT;
			Found = Cache.emplace( Count, BuildWorld( Count, HeavyExtras, HeavyExtras ) ).first;
		}
		return *Found->second;
	}

	void Recolor_FatStruct( benchmark::State& State )
	{
		const int32_t Count = static_cast<int32_t>( State.range( 0 ) );
		SWorld& World = GetWorld( Count );
		const uint32_t* pPalette = World.Palette.data();

		for ( auto _ : State )
		{
			for ( int32_t Index = 0; Index < Count; ++Index )
			{
				const SLocationFat& Location = World.Fat[ Index ];
				World.ColorBuffer[ Index ] = ComputeColor( Location.OwnerId, Location.TerrainType, Location.Flags, pPalette );
			}
			benchmark::ClobberMemory();
		}
		State.SetItemsProcessed( State.iterations() * Count );
		State.SetBytesProcessed( State.iterations() * Count * static_cast<int64_t>( sizeof( SLocationFat ) ) );
	}

	void Recolor_HotSlice( benchmark::State& State )
	{
		const int32_t Count = static_cast<int32_t>( State.range( 0 ) );
		SWorld& World = GetWorld( Count );
		const uint32_t* pPalette = World.Palette.data();

		for ( auto _ : State )
		{
			for ( int32_t Index = 0; Index < Count; ++Index )
			{
				const SColorInputs& Inputs = World.Slim[ Index ];
				World.ColorBuffer[ Index ] = ComputeColor( Inputs.OwnerId, Inputs.TerrainType, Inputs.Flags, pPalette );
			}
			benchmark::ClobberMemory();
		}
		State.SetItemsProcessed( State.iterations() * Count );
		State.SetBytesProcessed( State.iterations() * Count * static_cast<int64_t>( sizeof( SColorInputs ) ) );
	}

	void Recolor_SoA( benchmark::State& State )
	{
		const int32_t Count = static_cast<int32_t>( State.range( 0 ) );
		SWorld& World = GetWorld( Count );
		const uint32_t* pPalette = World.Palette.data();
		const uint32_t* pOwner = World.SoaOwner.data();
		const uint8_t* pTerrain = World.SoaTerrain.data();
		const uint8_t* pFlags = World.SoaFlags.data();

		for ( auto _ : State )
		{
			for ( int32_t Index = 0; Index < Count; ++Index )
			{
				World.ColorBuffer[ Index ] = ComputeColor( pOwner[ Index ], pTerrain[ Index ], pFlags[ Index ], pPalette );
			}
			benchmark::ClobberMemory();
		}
		State.SetItemsProcessed( State.iterations() * Count );
	}

	void Traverse_IndexedOrdered( benchmark::State& State )
	{
		const int32_t Count = static_cast<int32_t>( State.range( 0 ) );
		SWorld& World = GetWorld( Count );
		const uint32_t* pPalette = World.Palette.data();

		for ( auto _ : State )
		{
			for ( int32_t Index = 0; Index < Count; ++Index )
			{
				const SColorInputs& Inputs = World.Slim[ World.OrderedIndices[ Index ] ];
				World.ColorBuffer[ Index ] = ComputeColor( Inputs.OwnerId, Inputs.TerrainType, Inputs.Flags, pPalette );
			}
			benchmark::ClobberMemory();
		}
		State.SetItemsProcessed( State.iterations() * Count );
	}

	void Traverse_IndexedShuffled( benchmark::State& State )
	{
		const int32_t Count = static_cast<int32_t>( State.range( 0 ) );
		SWorld& World = GetWorld( Count );
		const uint32_t* pPalette = World.Palette.data();

		for ( auto _ : State )
		{
			for ( int32_t Index = 0; Index < Count; ++Index )
			{
				const SColorInputs& Inputs = World.Slim[ World.ShuffledIndices[ Index ] ];
				World.ColorBuffer[ Index ] = ComputeColor( Inputs.OwnerId, Inputs.TerrainType, Inputs.Flags, pPalette );
			}
			benchmark::ClobberMemory();
		}
		State.SetItemsProcessed( State.iterations() * Count );
	}

	template <int32_t Distance>
	void Traverse_IndexedShuffled_Prefetch( benchmark::State& State )
	{
		const int32_t Count = static_cast<int32_t>( State.range( 0 ) );
		SWorld& World = GetWorld( Count );
		const uint32_t* pPalette = World.Palette.data();

		for ( auto _ : State )
		{
			for ( int32_t Index = 0; Index < Count; ++Index )
			{
				if ( Index + Distance < Count )
				{
					_mm_prefetch( reinterpret_cast<const char*>( &World.Slim[ World.ShuffledIndices[ Index + Distance ] ] ), _MM_HINT_T0 );
				}
				const SColorInputs& Inputs = World.Slim[ World.ShuffledIndices[ Index ] ];
				World.ColorBuffer[ Index ] = ComputeColor( Inputs.OwnerId, Inputs.TerrainType, Inputs.Flags, pPalette );
			}
			benchmark::ClobberMemory();
		}
		State.SetItemsProcessed( State.iterations() * Count );
	}

	template <int32_t Distance>
	void Traverse_LinearPrefetch( benchmark::State& State )
	{
		const int32_t Count = static_cast<int32_t>( State.range( 0 ) );
		SWorld& World = GetWorld( Count );
		const uint32_t* pPalette = World.Palette.data();

		for ( auto _ : State )
		{
			for ( int32_t Index = 0; Index < Count; ++Index )
			{
				if ( Index + Distance < Count )
				{
					_mm_prefetch( reinterpret_cast<const char*>( &World.Slim[ Index + Distance ] ), _MM_HINT_T0 );
				}
				const SColorInputs& Inputs = World.Slim[ Index ];
				World.ColorBuffer[ Index ] = ComputeColor( Inputs.OwnerId, Inputs.TerrainType, Inputs.Flags, pPalette );
			}
			benchmark::ClobberMemory();
		}
		State.SetItemsProcessed( State.iterations() * Count );
	}

	void Traverse_HandlesShuffled( benchmark::State& State )
	{
		const int32_t Count = static_cast<int32_t>( State.range( 0 ) );
		SWorld& World = GetWorld( Count );
		const uint32_t* pPalette = World.Palette.data();

		for ( auto _ : State )
		{
			for ( int32_t Index = 0; Index < Count; ++Index )
			{
				const uint32_t Handle = World.ShuffledHandles[ Index ];
				const int32_t Slot = World.HandleToSlot[ Handle ];
				if ( Slot < 0 )
				{
					continue;
				}
				const SColorInputs* pInputs = World.SlotPointers[ Slot ];
				World.ColorBuffer[ Index ] = ComputeColor( pInputs->OwnerId, pInputs->TerrainType, pInputs->Flags, pPalette );
			}
			benchmark::ClobberMemory();
		}
		State.SetItemsProcessed( State.iterations() * Count );
	}

	void Traverse_HandlesOrdered( benchmark::State& State )
	{
		const int32_t Count = static_cast<int32_t>( State.range( 0 ) );
		SWorld& World = GetWorld( Count );
		const uint32_t* pPalette = World.Palette.data();

		for ( auto _ : State )
		{
			for ( int32_t Index = 0; Index < Count; ++Index )
			{
				const uint32_t Handle = World.OrderedIndices[ Index ];
				const int32_t Slot = World.HandleToSlot[ Handle ];
				if ( Slot < 0 )
				{
					continue;
				}
				const SColorInputs* pInputs = World.SlotPointers[ Slot ];
				World.ColorBuffer[ Index ] = ComputeColor( pInputs->OwnerId, pInputs->TerrainType, pInputs->Flags, pPalette );
			}
			benchmark::ClobberMemory();
		}
		State.SetItemsProcessed( State.iterations() * Count );
	}

	BENCHMARK( Recolor_FatStruct )->Arg( 4096 )->Arg( 32768 )->Arg( 262144 )->Unit( benchmark::kMicrosecond );
	BENCHMARK( Recolor_HotSlice )->Arg( 4096 )->Arg( 32768 )->Arg( 262144 )->Unit( benchmark::kMicrosecond );
	BENCHMARK( Recolor_SoA )->Arg( 4096 )->Arg( 32768 )->Arg( 262144 )->Unit( benchmark::kMicrosecond );

	constexpr int32_t L2_RESIDENT = 32768;
	constexpr int32_t RAM_RESIDENT = 4194304;

	BENCHMARK( Recolor_HotSlice )->Arg( RAM_RESIDENT )->Unit( benchmark::kMicrosecond );
	BENCHMARK( Traverse_IndexedOrdered )->Arg( L2_RESIDENT )->Arg( RAM_RESIDENT )->Unit( benchmark::kMicrosecond );
	BENCHMARK( Traverse_IndexedShuffled )->Arg( L2_RESIDENT )->Arg( RAM_RESIDENT )->Unit( benchmark::kMicrosecond );
	BENCHMARK_TEMPLATE( Traverse_IndexedShuffled_Prefetch, 4 )->Arg( L2_RESIDENT )->Arg( RAM_RESIDENT )->Unit( benchmark::kMicrosecond );
	BENCHMARK_TEMPLATE( Traverse_IndexedShuffled_Prefetch, 8 )->Arg( L2_RESIDENT )->Arg( RAM_RESIDENT )->Unit( benchmark::kMicrosecond );
	BENCHMARK_TEMPLATE( Traverse_IndexedShuffled_Prefetch, 16 )->Arg( L2_RESIDENT )->Arg( RAM_RESIDENT )->Unit( benchmark::kMicrosecond );
	BENCHMARK_TEMPLATE( Traverse_IndexedShuffled_Prefetch, 32 )->Arg( L2_RESIDENT )->Arg( RAM_RESIDENT )->Unit( benchmark::kMicrosecond );
	BENCHMARK_TEMPLATE( Traverse_IndexedShuffled_Prefetch, 64 )->Arg( RAM_RESIDENT )->Unit( benchmark::kMicrosecond );
	BENCHMARK_TEMPLATE( Traverse_IndexedShuffled_Prefetch, 128 )->Arg( RAM_RESIDENT )->Unit( benchmark::kMicrosecond );
	BENCHMARK_TEMPLATE( Traverse_IndexedShuffled_Prefetch, 256 )->Arg( RAM_RESIDENT )->Unit( benchmark::kMicrosecond );
	BENCHMARK_TEMPLATE( Traverse_LinearPrefetch, 8 )->Arg( L2_RESIDENT )->Arg( RAM_RESIDENT )->Unit( benchmark::kMicrosecond );
	BENCHMARK( Traverse_HandlesOrdered )->Arg( L2_RESIDENT )->Unit( benchmark::kMicrosecond );
	BENCHMARK( Traverse_HandlesShuffled )->Arg( L2_RESIDENT )->Unit( benchmark::kMicrosecond );
}

int main( int argc, char** argv )
{
	NPerf::PinToFirstPerformanceCore();

	printf( "sizeof( SLocationFat ) = %zu bytes\n", sizeof( NRecolorBench::SLocationFat ) );
	printf( "sizeof( SColorInputs ) = %zu bytes\n\n", sizeof( NRecolorBench::SColorInputs ) );

	benchmark::Initialize( &argc, argv );
	if ( benchmark::ReportUnrecognizedArguments( argc, argv ) )
	{
		return 1;
	}
	benchmark::RunSpecifiedBenchmarks();
	benchmark::Shutdown();
	return 0;
}
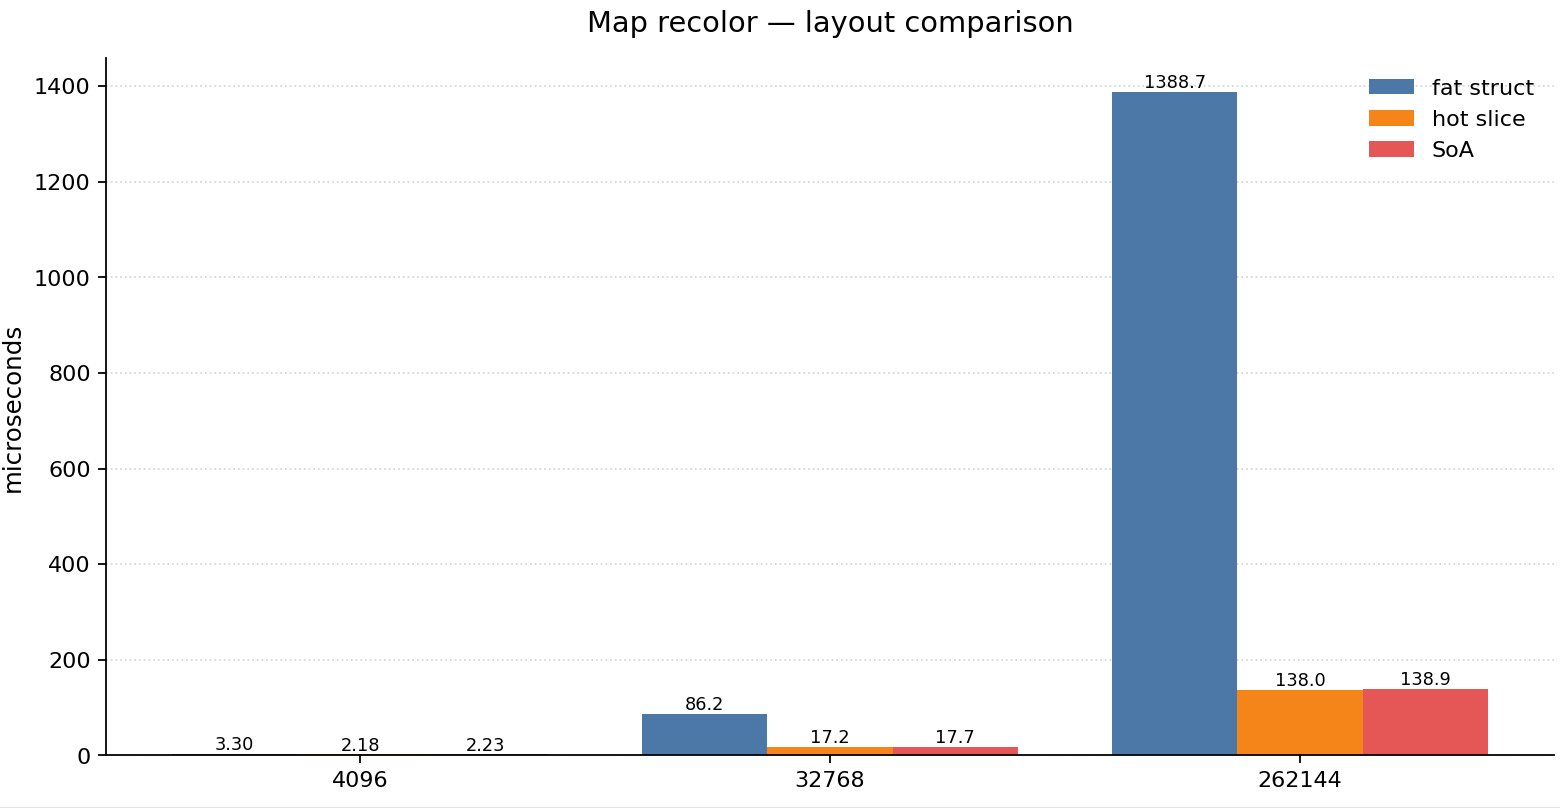
Both variants have the same amount of logic; the only difference is the struct layout. At 4096 locations the array of fat structs is a megabyte and a half, it fits in L2, and the slowdown is about x1.35, i.e. on a small map you simply won’t see this problem. At 32 768 locations/properties/pick-your-own the fat array is already 12 megabytes and gets kicked out of L2 into L3, making each access x5 more expensive, and at 262 144 it is 98 megabytes and gets kicked out of L3 as well, making access to it 10 times more expensive.
So the very same code that worked fine in a prototype with a small number of locations/units/properties degrades as the content grows, and in the profiler we see that “the game started lagging when we added more properties to the processing”, so we blame the processing algorithm, when it’s actually the structure that needs fixing. In essence, this is the same as spreading all the data across separate arrays (ECS/SoA), where each field lives in its own array.
void Recolor_SoA( benchmark::State& State )
{
	const int32_t Count = static_cast<int32_t>( State.range( 0 ) );
	SWorld& World = GetWorld( Count );
	const uint32_t* pPalette = World.Palette.data();
	const uint32_t* pOwner = World.SoaOwner.data();
	const uint8_t* pTerrain = World.SoaTerrain.data();
	const uint8_t* pFlags = World.SoaFlags.data();
	for ( auto _ : State )
	{
		for ( int32_t Index = 0; Index < Count; ++Index )
		{
			World.ColorBuffer[ Index ] = ComputeColor( pOwner[ Index ], pTerrain[ Index ], pFlags[ Index ], pPalette );
		}
		benchmark::ClobberMemory();
	}
	State.SetItemsProcessed( State.iterations() * Count );
}
The SoA variant gives the same result as moving the “hot data” into a separate struct (17.2 vs 17.4 microseconds at 32768). There is no difference because we read all three fields, so splitting them into separate arrays makes no sense, and the takeaway is that ECS is no silver bullet either: if you have extracted the hot data properly, the difference becomes negligible, and nobody forces you to drag a whole ECS framework into the game, or into places where it isn’t needed.
Expensive indirection
There have been so many articles on Habr about the cost of a pointer dereference, yet every self-respecting engine still steps on that rake with enviable regularity, and there is always an array of handles that sneaks into a lookup, the lookup goes to the object manager, and the manager reaches through a couple of pointers for the object itself, which naturally lives on the heap.
for (int32_t Index = 0; Index < Count; ++Index)
{
    const uint32_t Handle = _VisibleHandles[Index];
    const int32_t Slot = _HandleToSlot[Handle];
    if (Slot < 0)
    {
        continue;
    }
    const SColorInputs* pInputs = _SlotPointers[Slot];
    _ColorBuffer[Index] = ComputeColor(pInputs->OwnerId,
                                       pInputs->TerrainType,
                                       pInputs->Flags,
                                       pPalette);
}
For those who like digging through code
#include <cstdio>

#include <benchmark/benchmark.h>

#include "map_bench_world.h"
#include "perf_common.h"

namespace NIndirection
{
	using NMapBenchWorld::ComputeColor;
	using NMapBenchWorld::GetWorld;
	using NMapBenchWorld::SColorInputs;
	using NMapBenchWorld::SWorld;

	void DenseLinear( benchmark::State& State )
	{
		const int32_t Count = static_cast<int32_t>( State.range( 0 ) );
		SWorld& World = GetWorld( Count, false, false );
		const uint32_t* pPalette = World.Palette.data();

		for ( auto _ : State )
		{
			for ( int32_t Index = 0; Index < Count; ++Index )
			{
				const SColorInputs& Inputs = World.Slim[ Index ];
				World.ColorBuffer[ Index ] = ComputeColor( Inputs.OwnerId, Inputs.TerrainType, Inputs.Flags, pPalette );
			}
			benchmark::ClobberMemory();
		}
		State.SetItemsProcessed( State.iterations() * Count );
	}

	void IndexedOrdered( benchmark::State& State )
	{
		const int32_t Count = static_cast<int32_t>( State.range( 0 ) );
		SWorld& World = GetWorld( Count, false, false );
		const uint32_t* pPalette = World.Palette.data();

		for ( auto _ : State )
		{
			for ( int32_t Index = 0; Index < Count; ++Index )
			{
				const SColorInputs& Inputs = World.Slim[ World.OrderedIndices[ Index ] ];
				World.ColorBuffer[ Index ] = ComputeColor( Inputs.OwnerId, Inputs.TerrainType, Inputs.Flags, pPalette );
			}
			benchmark::ClobberMemory();
		}
		State.SetItemsProcessed( State.iterations() * Count );
	}

	void IndexedShuffled( benchmark::State& State )
	{
		const int32_t Count = static_cast<int32_t>( State.range( 0 ) );
		SWorld& World = GetWorld( Count, false, true );
		const uint32_t* pPalette = World.Palette.data();

		for ( auto _ : State )
		{
			for ( int32_t Index = 0; Index < Count; ++Index )
			{
				const SColorInputs& Inputs = World.Slim[ World.ShuffledIndices[ Index ] ];
				World.ColorBuffer[ Index ] = ComputeColor( Inputs.OwnerId, Inputs.TerrainType, Inputs.Flags, pPalette );
			}
			benchmark::ClobberMemory();
		}
		State.SetItemsProcessed( State.iterations() * Count );
	}

	void HandlesOrdered( benchmark::State& State )
	{
		const int32_t Count = static_cast<int32_t>( State.range( 0 ) );
		SWorld& World = GetWorld( Count, false, true );
		const uint32_t* pPalette = World.Palette.data();

		for ( auto _ : State )
		{
			for ( int32_t Index = 0; Index < Count; ++Index )
			{
				const uint32_t Handle = World.OrderedIndices[ Index ];
				const int32_t Slot = World.HandleToSlot[ Handle ];
				if ( Slot < 0 )
				{
					continue;
				}
				const SColorInputs* pInputs = World.SlotPointers[ Slot ];
				World.ColorBuffer[ Index ] = ComputeColor( pInputs->OwnerId, pInputs->TerrainType, pInputs->Flags, pPalette );
			}
			benchmark::ClobberMemory();
		}
		State.SetItemsProcessed( State.iterations() * Count );
	}

	void HandlesShuffled( benchmark::State& State )
	{
		const int32_t Count = static_cast<int32_t>( State.range( 0 ) );
		SWorld& World = GetWorld( Count, false, true );
		const uint32_t* pPalette = World.Palette.data();

		for ( auto _ : State )
		{
			for ( int32_t Index = 0; Index < Count; ++Index )
			{
				const uint32_t Handle = World.ShuffledHandles[ Index ];
				const int32_t Slot = World.HandleToSlot[ Handle ];
				if ( Slot < 0 )
				{
					continue;
				}
				const SColorInputs* pInputs = World.SlotPointers[ Slot ];
				World.ColorBuffer[ Index ] = ComputeColor( pInputs->OwnerId, pInputs->TerrainType, pInputs->Flags, pPalette );
			}
			benchmark::ClobberMemory();
		}
		State.SetItemsProcessed( State.iterations() * Count );
	}

	BENCHMARK( DenseLinear )->Arg( 32768 )->Unit( benchmark::kMicrosecond );
	BENCHMARK( IndexedOrdered )->Arg( 32768 )->Unit( benchmark::kMicrosecond );
	BENCHMARK( IndexedShuffled )->Arg( 32768 )->Arg( 4194304 )->Unit( benchmark::kMicrosecond );
	BENCHMARK( HandlesOrdered )->Arg( 32768 )->Unit( benchmark::kMicrosecond );
	BENCHMARK( HandlesShuffled )->Arg( 32768 )->Unit( benchmark::kMicrosecond );
}

int main( int argc, char** argv )
{
	NPerf::PinToFirstPerformanceCore();
	printf( "07_indirection\n\n" );

	benchmark::Initialize( &argc, argv );
	if ( benchmark::ReportUnrecognizedArguments( argc, argv ) )
	{
		return 1;
	}
	benchmark::RunSpecifiedBenchmarks();
	benchmark::Shutdown();
	return 0;
}
| traversal | time |
| ----------------------------------- | ----- |
| dense array, sequential | 17.4 |
| via index buffer, in order | 22.9 |
| via index buffer, shuffled | 29.8 |
| via handles and manager, in order | 40.4 |
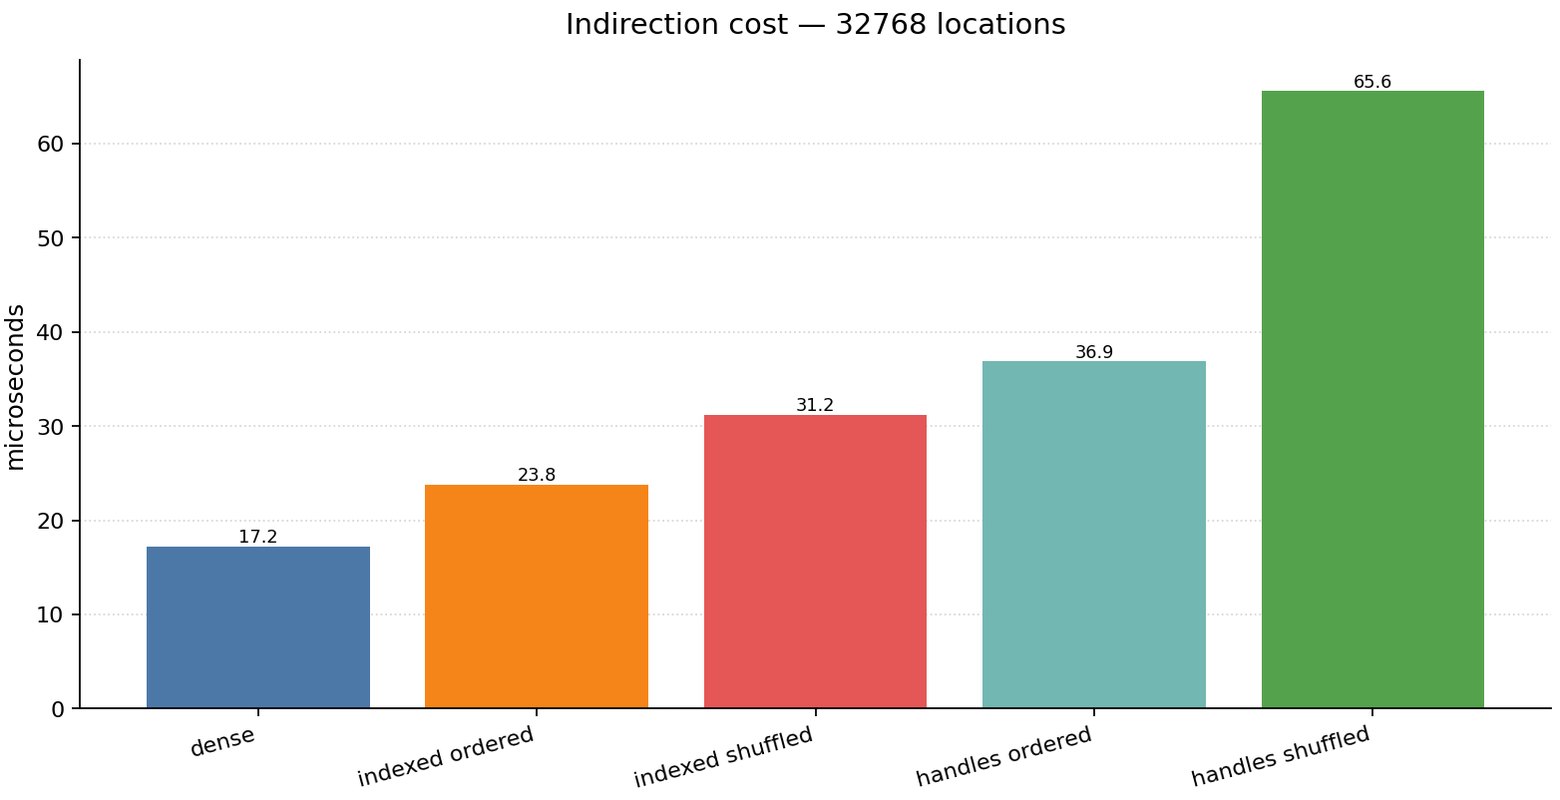
| via handles and manager, shuffled | 64.1 |There is a 4x difference between the first and the last row, and the code differs only in how many times we jumped through a pointer and in what order, to get the very same result at the output.
Going through an index alone costs almost thirty percent even with an ideal traversal order, shuffled order adds as much again, and double indirection through the manager plus objects scattered across the heap adds even more, because each object was allocated with its own new and lives wherever there happened to be room for it, not next to its neighbours.
On a big map this gets extra conditions on top, and that x4 easily turns into x5, x10, x20. That is exactly the price of random access, and the reason why even today you have to lay data out sequentially.
Software prefetch
You may have heard of the _mm_prefetch intrinsic, and that it is used when the data access pattern is complex and isn’t detected by the prediction unit, and maybe you have even put it in your code and wondered why it didn’t work... and for many people it didn’t, but not because the intrinsic itself doesn’t work. Let’s take the same shuffled traversal from the previous section: in the first case the array is 256 kilobytes and sits entirely in L2, and in the second it is 32 megabytes and doesn’t fit in L3.
template <int32_t Distance>
void Traverse(...)
{
    for (int32_t Index = 0; Index < Count; ++Index)
    {
        if (Index + Distance < Count)
        {
            _mm_prefetch(&_Data[_Indices[Index + Distance]], _MM_HINT_T0);
        }
        Process(_Data[_Indices[Index]]);
    }
}

| distance     | 256 KB (L2)   | 32 MB (memory)   |
| ------------ | ------------- | ---------------- |
| no prefetch  | 29.8          | 35 978           |
| 4            | 33.3          | 30 071           |
| 8            | 34.1          | 26 034           |
| 16           | 33.1          | 22 510           |
| 32           | 37.4          | 16 329           |
| 64           | -             | 18 163           |
| 128          | -             | 21 266           |
| 256          | -             | 19 256           |
Benchmark code
#include <algorithm>
#include <cstdint>
#include <cstdio>
#include <map>
#include <memory>
#include <random>
#include <unordered_map>
#include <vector>

#include <benchmark/benchmark.h>

#include "perf_common.h"

namespace NPolymorphism
{
	class IUnitBehavior
	{
	public:
		virtual ~IUnitBehavior() = default;
		virtual uint32_t Evaluate( uint32_t Input ) const = 0;
	};

	class CInfantry final : public IUnitBehavior
	{
	public:
		explicit CInfantry( uint32_t Strength ) : _Strength( Strength ) {}
		uint32_t Evaluate( uint32_t Input ) const override { return Input * 3u + _Strength; }

	private:
		uint32_t _Strength;
	};

	class CCavalry final : public IUnitBehavior
	{
	public:
		explicit CCavalry( uint32_t Strength ) : _Strength( Strength ) {}
		uint32_t Evaluate( uint32_t Input ) const override { return Input * 5u - _Strength; }

	private:
		uint32_t _Strength;
	};

	class CArtillery final : public IUnitBehavior
	{
	public:
		explicit CArtillery( uint32_t Strength ) : _Strength( Strength ) {}
		uint32_t Evaluate( uint32_t Input ) const override { return ( Input ^ _Strength ) * 7u; }

	private:
		uint32_t _Strength;
	};

	enum class EUnitType : uint8_t
	{
		Infantry,
		Cavalry,
		Artillery
	};

	struct SUnit
	{
		uint32_t Strength;
		EUnitType Type;
		uint8_t Padding[ 3 ];
	};

	inline uint32_t EvaluateByTag( const SUnit& Unit, uint32_t Input )
	{
		switch ( Unit.Type )
		{
			case EUnitType::Infantry: return Input * 3u + Unit.Strength;
			case EUnitType::Cavalry: return Input * 5u - Unit.Strength;
			case EUnitType::Artillery: return ( Input ^ Unit.Strength ) * 7u;
		}
		return 0u;
	}

	struct SArmy
	{
		std::vector<std::unique_ptr<IUnitBehavior>> Owned;
		std::vector<IUnitBehavior*> Scattered;
		std::vector<SUnit> Mixed;
		std::vector<SUnit> Grouped;
	};

	SArmy& GetArmy( int32_t Count )
	{
		static std::map<int32_t, SArmy*> Cache;
		auto Found = Cache.find( Count );
		if ( Found != Cache.end() )
		{
			return *Found->second;
		}

		SArmy* pArmy = new SArmy();
		std::mt19937 Rng( 20260801u );

		pArmy->Owned.reserve( Count );
		pArmy->Scattered.reserve( Count );
		pArmy->Mixed.reserve( Count );

		for ( int32_t Index = 0; Index < Count; ++Index )
		{
			const uint32_t Strength = Rng() & 0xFFFFu;
			const EUnitType Type = static_cast<EUnitType>( Rng() % 3u );

			std::unique_ptr<IUnitBehavior> Unit;
			switch ( Type )
			{
				case EUnitType::Infantry: Unit = std::make_unique<CInfantry>( Strength ); break;
				case EUnitType::Cavalry: Unit = std::make_unique<CCavalry>( Strength ); break;
				case EUnitType::Artillery: Unit = std::make_unique<CArtillery>( Strength ); break;
			}
			pArmy->Scattered.push_back( Unit.get() );
			pArmy->Owned.push_back( std::move( Unit ) );

			SUnit Tagged = {};
			Tagged.Strength = Strength;
			Tagged.Type = Type;
			pArmy->Mixed.push_back( Tagged );
		}

		std::shuffle( pArmy->Scattered.begin(), pArmy->Scattered.end(), Rng );

		pArmy->Grouped = pArmy->Mixed;
		std::stable_sort( pArmy->Grouped.begin(), pArmy->Grouped.end(),
			[]( const SUnit& Left, const SUnit& Right ) { return Left.Type < Right.Type; } );

		Cache.emplace( Count, pArmy );
		return *pArmy;
	}

	void Evaluate_VirtualScattered( benchmark::State& State )
	{
		const int32_t Count = static_cast<int32_t>( State.range( 0 ) );
		SArmy& Army = GetArmy( Count );
		for ( auto _ : State )
		{
			uint32_t Total = 0;
			for ( int32_t Index = 0; Index < Count; ++Index )
			{
				Total += Army.Scattered[ Index ]->Evaluate( static_cast<uint32_t>( Index ) );
			}
			benchmark::DoNotOptimize( Total );
		}
		State.SetItemsProcessed( State.iterations() * Count );
	}

	void Evaluate_TagMixed( benchmark::State& State )
	{
		const int32_t Count = static_cast<int32_t>( State.range( 0 ) );
		SArmy& Army = GetArmy( Count );
		for ( auto _ : State )
		{
			uint32_t Total = 0;
			for ( int32_t Index = 0; Index < Count; ++Index )
			{
				Total += EvaluateByTag( Army.Mixed[ Index ], static_cast<uint32_t>( Index ) );
			}
			benchmark::DoNotOptimize( Total );
		}
		State.SetItemsProcessed( State.iterations() * Count );
	}

	void Evaluate_TagGrouped( benchmark::State& State )
	{
		const int32_t Count = static_cast<int32_t>( State.range( 0 ) );
		SArmy& Army = GetArmy( Count );
		for ( auto _ : State )
		{
			uint32_t Total = 0;
			for ( int32_t Index = 0; Index < Count; ++Index )
			{
				Total += EvaluateByTag( Army.Grouped[ Index ], static_cast<uint32_t>( Index ) );
			}
			benchmark::DoNotOptimize( Total );
		}
		State.SetItemsProcessed( State.iterations() * Count );
	}

	BENCHMARK( Evaluate_VirtualScattered )->Arg( 262144 )->Unit( benchmark::kMicrosecond );
	BENCHMARK( Evaluate_TagMixed )->Arg( 262144 )->Unit( benchmark::kMicrosecond );
	BENCHMARK( Evaluate_TagGrouped )->Arg( 262144 )->Unit( benchmark::kMicrosecond );
}

int main( int argc, char** argv )
{
	NPerf::PinToFirstPerformanceCore();
	printf( "08_virtual_vs_tag\n" );
	printf( "sizeof( SUnit ) = %zu\n\n", sizeof( NPolymorphism::SUnit ) );
	benchmark::Initialize( &argc, argv );
	if ( benchmark::ReportUnrecognizedArguments( argc, argv ) )
	{
		return 1;
	}
	benchmark::RunSpecifiedBenchmarks();
	benchmark::Shutdown();
	return 0;
}
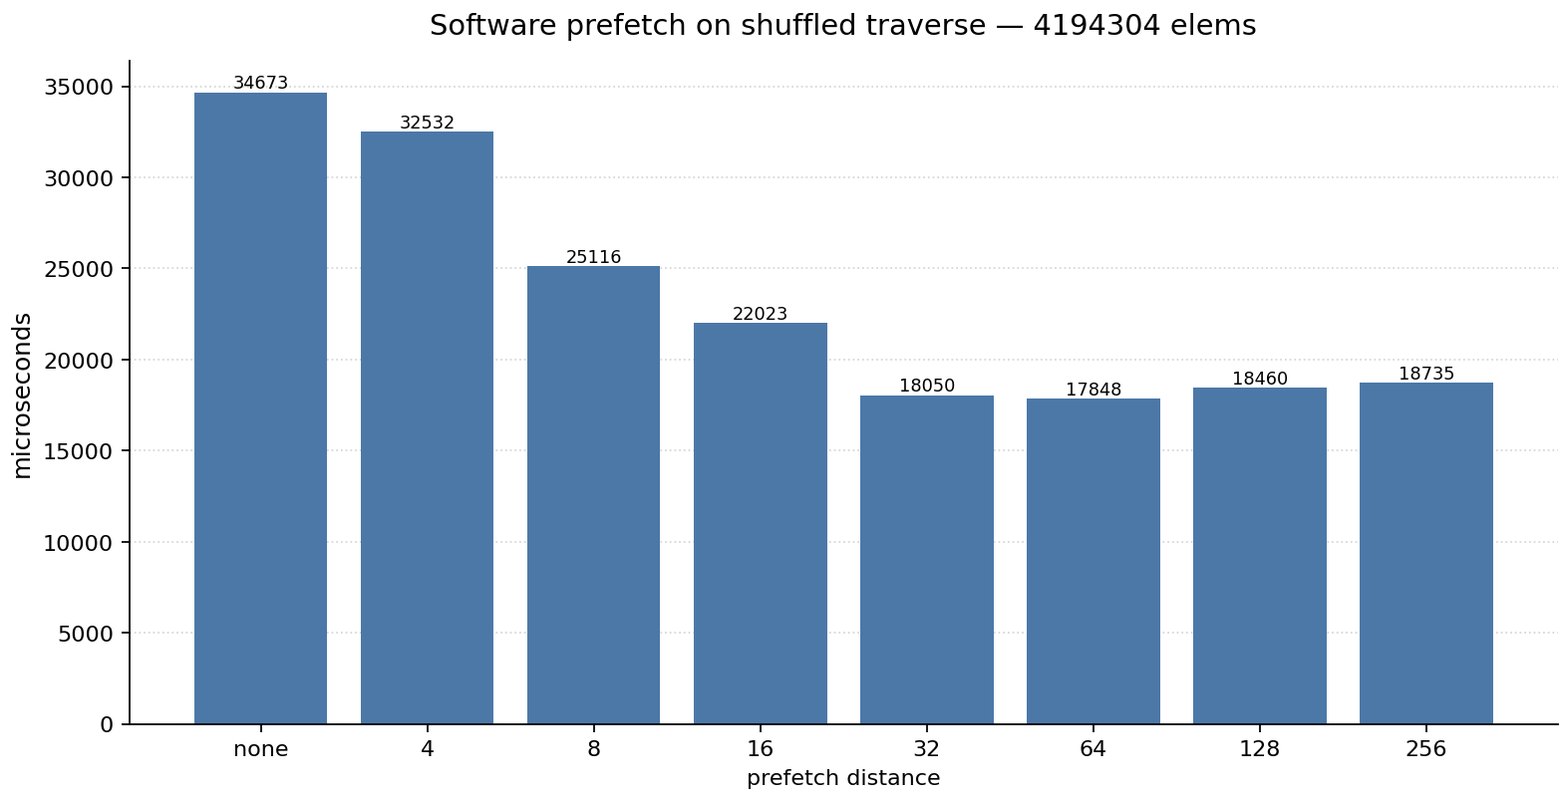
If your array is small, prefetching gives you nothing even on a complex pattern (see the left column), at any distance, and in places it even made things worse by adding work to the algorithm. That is the expected result, because the data is already in L2 and there is nothing to bring in, but you’ve added instructions — and sadly, that is what most of the places where people try to bolt on the poor prefetch look like.
But when the data is really big, the working set is megabytes and the access pattern is complex, prefetch starts to work (see the second, right column), but note the shape of the gain: a distance of 4 elements is almost useless, because the data you queued for loading is already right next door and the repeated request gets dropped; at 8 and 16 it gets better, pulling part of the data in ahead of time, and the optimum is at 32, because by the time Process gets to the needed elements they are already in the cache, and we really did remove the bottleneck with prefetch, letting the algorithm run without stalls.
Beyond that it gets worse again, because we brought the data in early, but it is again far from the working area and gets evicted before it is needed. So it turns out that __mm_prefetch is used wrong, and my personal stats from fixing this stuff say that 80% of the uses are wrong, i.e. it either gave no gain or gave a negative one. But people’s faith in the power of prefetch never fades, and lets it sail through code review with ease.
And don’t trust anyone who promises you a multiple-x speedup from a single “prefetch” call. There is no universally correct prefetch number: it depends on the element size, on how much work is done per iteration, on the specific CPU, and tuning it by hand means selling every player whatever worked for you on your machine. If you can’t name the CPU this will work on, the size of your working array and which cache level the data fits in, then a prefetch stuck in “just because” will at best leave you with the milliseconds you started with.
Virtual calls are not that expensive after all
class IUnitBehavior
{
public:
    virtual ~IUnitBehavior() = default;
    virtual uint32_t Evaluate(uint32_t Input) const = 0;
};
We have a class like this in the engine that can be attached to a unit to slightly change its behaviour; you can hang a lot of those “slightlies” on a single object, and at some point Evaluate became visible in the profiler. Lots of objects, lots of properties, and the sheer number of Evaluate calls started to matter, so at some point we had to drop virtuals in favour of a more blunt solution.
struct SBeh
{
    uint32_t Strength;
    EBehType Type;
    uint8_t Padding[3];
};

inline uint32_t EvaluateByTag(const SBeh& Unit, uint32_t Input)
{
    switch (Unit.Type)
    {
        case EBehType::Move:  return Input * 3u + Unit.Strength;
        case EBehType::BuffRun:   return Input * 5u - Unit.Strength;
        case EBehType::BuffShoot: return (Input ^ Unit.Strength) * 7u;
    }
    return 0u;
}

| traversal                                     | time  | vs virtual     |
| --------------------------------------------- | ----- | -------------- |
| virtual call, objects scattered on the heap   | 1990  | 1.0            |
| tag + switch, types mixed                     | 1078  | 1.8            |
| tag + switch, sorted by type                  | 162   | 12.3           |
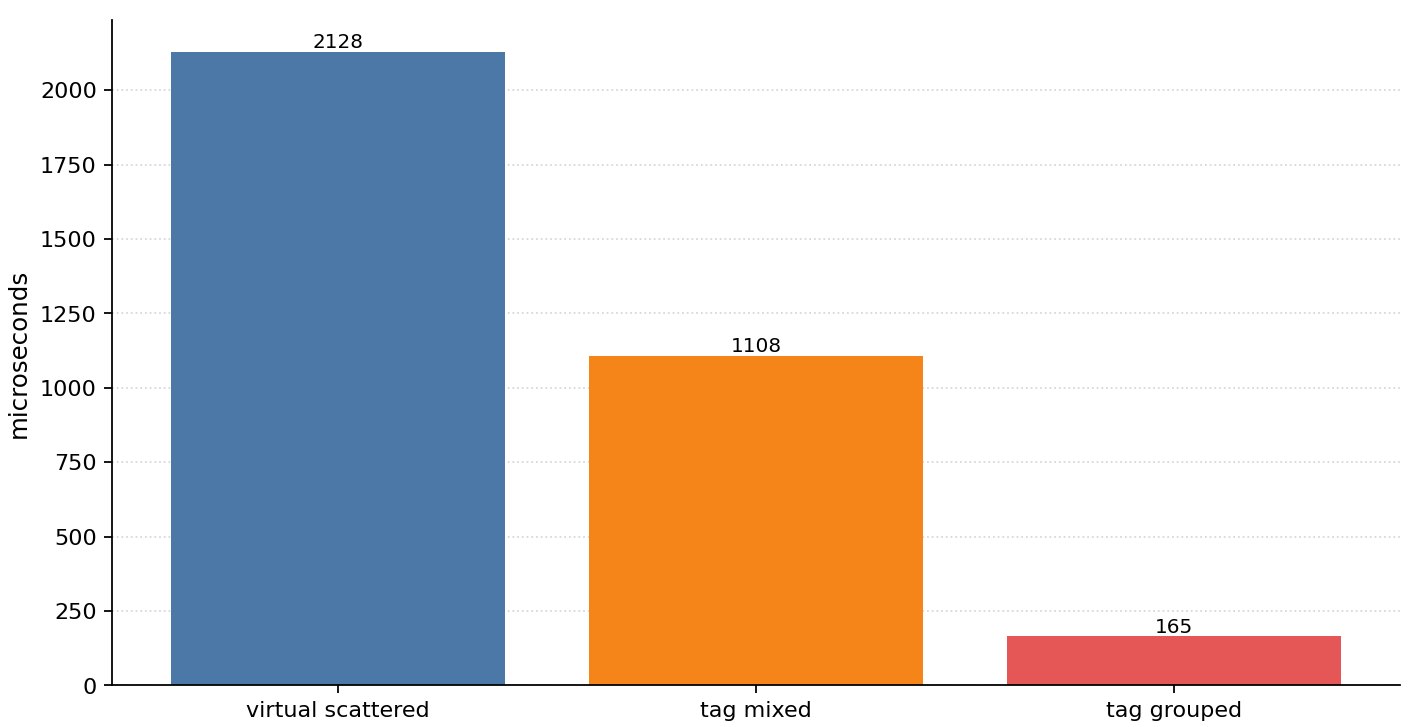
sizeof(SBeh) is eight bytes, and I ran the test on 262 144 “properties”, which is a bit less than a session accumulates by the late game. But just removing virtuals and moving to a dense array gave only x2 on call time, and the function was still hanging around in the profiler, so we started looking at what else was getting in the way. The virtual call was, again, about indirection, and fixing the pointer access by turning it into a switch was a relatively “wise” decision, but on modern CPUs with big jump tables it gives a weak result, which is largely eaten up by the high-level logic.
It didn’t solve the main perf problem, because it removed only one hop to memory, while the objects scattered across memory stayed just as scattered. Now, instead of indirection on a virtual call, we got a bunch of switch over shuffled types, swapping an unpredictable memory hop for an unpredictable branch.
The branch predictor misses more and more often the more types you have, and every miss costs a dozen-plus cycles. Seeing that, we took one more small step and grouped the data by type; now the predictor always guesses right, except for a few transitions at group boundaries, and the switch effectively disappears.
There is no moral here, but if you ever feel like going to the trouble of rewriting a polymorphic hierarchy into a dense array, I suggest looking for a different solution: most likely the win won’t be where you expect it, and where it actually is, you’ll have to go looking.
The bench, for those who like digging through code
#include <algorithm>
#include <cstdint>
#include <cstdio>
#include <map>
#include <memory>
#include <random>
#include <unordered_map>
#include <vector>

#include <benchmark/benchmark.h>

#include "perf_common.h"

namespace NPolymorphism
{
	class IBeh
	{
	public:
		virtual ~IBeh() = default;
		virtual uint32_t Evaluate( uint32_t Input ) const = 0;
	};

	class CMeleeBeh final : public IBeh
	{
	public:
		explicit CMeleeBeh( uint32_t Strength ) : _Strength( Strength ) {}
		uint32_t Evaluate( uint32_t Input ) const override { return Input * 3u + _Strength; }

	private:
		uint32_t _Strength;
	};

	class CChargeBeh final : public IBeh
	{
	public:
		explicit CChargeBeh( uint32_t Strength ) : _Strength( Strength ) {}
		uint32_t Evaluate( uint32_t Input ) const override { return Input * 5u - _Strength; }

	private:
		uint32_t _Strength;
	};

	class CBarrageBeh final : public IBeh
	{
	public:
		explicit CBarrageBeh( uint32_t Strength ) : _Strength( Strength ) {}
		uint32_t Evaluate( uint32_t Input ) const override { return ( Input ^ _Strength ) * 7u; }

	private:
		uint32_t _Strength;
	};

	enum class EBehType : uint8_t
	{
		Melee,
		Charge,
		Barrage
	};

	struct SBeh
	{
		uint32_t Strength;
		EBehType Type;
		uint8_t Padding[ 3 ];
	};

	inline uint32_t EvaluateByTag( const SBeh& Beh, uint32_t Input )
	{
		switch ( Beh.Type )
		{
			case EBehType::Melee: return Input * 3u + Beh.Strength;
			case EBehType::Charge: return Input * 5u - Beh.Strength;
			case EBehType::Barrage: return ( Input ^ Beh.Strength ) * 7u;
		}
		return 0u;
	}

	struct SBehSet
	{
		std::vector<std::unique_ptr<IBeh>> Owned;
		std::vector<IBeh*> Scattered;
		std::vector<SBeh> Mixed;
		std::vector<SBeh> Grouped;
	};

	SBehSet& GetBehSet( int32_t Count )
	{
		static std::map<int32_t, SBehSet*> Cache;
		auto Found = Cache.find( Count );
		if ( Found != Cache.end() )
		{
			return *Found->second;
		}

		SBehSet* pSet = new SBehSet();
		std::mt19937 Rng( 20260801u );

		pSet->Owned.reserve( Count );
		pSet->Scattered.reserve( Count );
		pSet->Mixed.reserve( Count );

		for ( int32_t Index = 0; Index < Count; ++Index )
		{
			const uint32_t Strength = Rng() & 0xFFFFu;
			const EBehType Type = static_cast<EBehType>( Rng() % 3u );

			std::unique_ptr<IBeh> Beh;
			switch ( Type )
			{
				case EBehType::Melee: Beh = std::make_unique<CMeleeBeh>( Strength ); break;
				case EBehType::Charge: Beh = std::make_unique<CChargeBeh>( Strength ); break;
				case EBehType::Barrage: Beh = std::make_unique<CBarrageBeh>( Strength ); break;
			}
			pSet->Scattered.push_back( Beh.get() );
			pSet->Owned.push_back( std::move( Beh ) );

			SBeh Tagged = {};
			Tagged.Strength = Strength;
			Tagged.Type = Type;
			pSet->Mixed.push_back( Tagged );
		}

		std::shuffle( pSet->Scattered.begin(), pSet->Scattered.end(), Rng );

		pSet->Grouped = pSet->Mixed;
		std::stable_sort( pSet->Grouped.begin(), pSet->Grouped.end(),
			[]( const SBeh& Left, const SBeh& Right ) { return Left.Type < Right.Type; } );

		Cache.emplace( Count, pSet );
		return *pSet;
	}

	void Evaluate_VirtualScattered( benchmark::State& State )
	{
		const int32_t Count = static_cast<int32_t>( State.range( 0 ) );
		SBehSet& Set = GetBehSet( Count );
		for ( auto _ : State )
		{
			uint32_t Total = 0;
			for ( int32_t Index = 0; Index < Count; ++Index )
			{
				Total += Set.Scattered[ Index ]->Evaluate( static_cast<uint32_t>( Index ) );
			}
			benchmark::DoNotOptimize( Total );
		}
		State.SetItemsProcessed( State.iterations() * Count );
	}

	void Evaluate_TagMixed( benchmark::State& State )
	{
		const int32_t Count = static_cast<int32_t>( State.range( 0 ) );
		SBehSet& Set = GetBehSet( Count );
		for ( auto _ : State )
		{
			uint32_t Total = 0;
			for ( int32_t Index = 0; Index < Count; ++Index )
			{
				Total += EvaluateByTag( Set.Mixed[ Index ], static_cast<uint32_t>( Index ) );
			}
			benchmark::DoNotOptimize( Total );
		}
		State.SetItemsProcessed( State.iterations() * Count );
	}

	void Evaluate_TagGrouped( benchmark::State& State )
	{
		const int32_t Count = static_cast<int32_t>( State.range( 0 ) );
		SBehSet& Set = GetBehSet( Count );
		for ( auto _ : State )
		{
			uint32_t Total = 0;
			for ( int32_t Index = 0; Index < Count; ++Index )
			{
				Total += EvaluateByTag( Set.Grouped[ Index ], static_cast<uint32_t>( Index ) );
			}
			benchmark::DoNotOptimize( Total );
		}
		State.SetItemsProcessed( State.iterations() * Count );
	}

	BENCHMARK( Evaluate_VirtualScattered )->Arg( 262144 )->Unit( benchmark::kMicrosecond );
	BENCHMARK( Evaluate_TagMixed )->Arg( 262144 )->Unit( benchmark::kMicrosecond );
	BENCHMARK( Evaluate_TagGrouped )->Arg( 262144 )->Unit( benchmark::kMicrosecond );
}

int main( int argc, char** argv )
{
	NPerf::PinToFirstPerformanceCore();
	printf( "08_virtual_vs_tag\n" );
	printf( "sizeof( SBeh ) = %zu\n\n", sizeof( NPolymorphism::SBeh ) );
	benchmark::Initialize( &argc, argv );
	if ( benchmark::ReportUnrecognizedArguments( argc, argv ) )
	{
		return 1;
	}
	benchmark::RunSpecifiedBenchmarks();
	benchmark::Shutdown();
	return 0;
}
Not every cache stall is a cache stall
Having fixed the frame time a bit and gotten rid of the daily spikes, I stumbled upon the weekly tick over the buildings array, where each building has an IsProducing flag and an Output property, and we sum the output of only those that are actually working right now, using the dumbest loop imaginable.
for (int32_t Index = 0; Index < Count; ++Index)
{
    if (IsProducing[Index] != 0)
    {
        TotalOutput += Output[Index];
    }
}

| data                               | time, µs   |
| flags shuffled                     | 93.9       |
| flags sorted                       | 11.2       |
| flags shuffled, but branchless     | 16.1       |
So what is the table above about, and where does the 8.4x gain between the first and second rows come from? This has nothing whatsoever to do with the cache anymore, since the arrays are the same and are read linearly. The whole difference is that on shuffled flags the branch predictor guesses right half the time, and every miss costs ten to fifteen cycles for a pipeline flush.
And if you sort the data first, all the idle ones come first and then all the working ones, and the predictor misses once, at the boundary. How to get a sorted array is another question, but if the daily update has time left in the frame, it can sort such arrays, and then by the start of the weekly update we have an array ready to go and a gain. Also keep in mind that sorting an almost sorted array is much cheaper than sorting an unsorted one, so it pays off to keep this array in the right state all the time, smearing the total compute time across frames to lower the peak load.
Third row: remove the if from the code and replace it with arithmetic, which gives a comparable gain, though the question of why the compiler didn’t do this on its own remains open. There is no branch anymore, nothing to predict, and the time drops almost to the level of the sorted data, even though we didn’t touch the order of the flags.
const uint64_t Mask = (uint64_t)(0u - (uint32_t)(IsProducing[Index] != 0));
TotalOutput += Output[Index] & Mask;
Why is this in an article about memory? Because x8 is more than any of my data layout optimizations gave, and if you come to a hot loop with the hypothesis “it’s cache misses” and start repacking structures while the real cause is an unpredictable if inside the loop, you will spend a day and get zero. So by all means reason about cache misses, but first prove that it really is a cache miss and not something else, because each needs a completely different treatment.
And while I was running these experiments...
This is no longer directly about optimizations.
For the benchmarks I wrote a cache polluter that rewrote the same two megabytes every frame, on the simple assumption that if you write to memory, the cache gets flushed. Except the L3 on this machine is 30 megabytes, and my two megabytes evicted exactly two megabytes, so the big nine-megabyte array stayed in L3 the whole time. And the first runs showed a 0.05 millisecond difference between cold and hot cache, because there was no cold access in the experiment at all.
I noticed that and raised the eviction to 24 megabytes per frame, and it got even worse: now the polluter itself took 0.8 milliseconds and its noise completely drowned out what I was measuring. So I switched to updating 2 megabytes of fresh memory per frame, but each time in a new spot of a big buffer; over 30 frames that adds up to 60 megabytes of different memory and L3 gets “washed out” entirely, while the per-frame load stays very small, which came close to the picture I was seeing in the real project.
Prefetch on a 256-kilobyte array might never have made it in here, since 256 kilobytes sit entirely in L2 and there are simply no misses there, and I was about to toss the idea as a dud. But then something nudged me to try prefetch on 32 megabytes, and there the very same code gave x2. This optimization still didn’t make it into the project, for the reasons given earlier.
Hardware warming
Besides poking data by hand, CPUs in consoles and servers can keep a needed chunk of memory in the cache at the hardware level. With Intel (Cache Pseudo-Locking) you configure part of the cache for critical data, then that part is exposed as a character device and you work with it via mmap. AMD (L3 Cache Range Reservation) lets you reserve a range of physical addresses in L3, although the SDK user documentation only mentions the feature in passing, and how to actually use it you have to figure out yourself.
All of this works on L2 or L3, but not on L1, i.e. you still won’t be allowed to get your hands on the fastest level, and all of it needs privileges and a configured machine, which a game on a player’s machine almost never has, but it comes in handy if you are writing a dedicated server that you host yourself.
On PS5 you can lock up to 256 kilobytes of L2 and “keep data in fast memory”, but there are plenty of surprises too, because there is no invisible eviction policy and you have to manage it all by hand. And in general, discussing warmup for console projects is pointless, because the cache is small as it is, and taking part of it away is a great way to shoot yourself in the foot, so on consoles people usually start by shrinking their hot structures.
Software cache warming is a medicine, but most likely not for the problems you are seeing in your profiler, and ending up with weird, invisible stalls whose origin you’ll have a hell of a time figuring out is entirely possible.
P.S. I am not urging anyone to do anything and I won’t recommend using software warming; all the code and examples are provided for educational purposes only.
All articles