
If you look at the general bloat of modern software, 100-gigabyte game downloads, the annual Nvidia X090 giving +20% year over year, and 20-core processors, then from the outside it might seem that performance optimization of anything — games or other software — has, supposedly, lost its relevance. In an era of unpunished hardware performance you can spill out even half of that power, and the user won't even notice. All of this may be true, if you're not making a game. So why then, on those twenty cores, does a game released two years ago freeze and stutter (good thing it doesn't crash often)?
I won't tell you why it stutters: maybe the developers who made it (on not the newest engine, it has to be said) were just making a game and didn't think about ordinary players sitting on five-year-old hardware — even though five-year-old hardware beats the current-generation consoles. Maybe it's a different reason — when your work machine with 64 gigabytes of RAM and a 4080 on board runs the editor just fine, you can start worrying about players after the day-one patch.
The thing is, all those 30 — 60 — 120 — 200 fps in games are a purely marketing metric, the rate at which the engine can produce frames for the video card; but an engine isn't only the picture. There's physics — and it worked at 30 fps ten years ago and works the same way now. Or the audio subsystem, which lives its own separate life in its own priority threads; mostly we just throw messages at it with settings and a frame number to sync it with the picture. It's hard, but solvable — yet sound isn't tied to the picture.
Input — it too lives separately in its own threads, and likewise sends messages, only to other systems. Various data caching and buffering systems — you can ignore those too, because modern rendering is almost entirely deferred; everything that can be deferred will be deferred — models, textures, shaders — they'll be in some indeterminate state, like a blurry texture or a common shader stretched over the model. And then, as resources load, the real data gets pulled in.
With some stretch you can lump game logic in here too — it has ballooned from blueprints and various visual development systems, but there again it's all delta-time-oriented code, with no binding to fps. Game logic can calmly skip two or three, up to dozens of frames; consequences noticeable to the player only show up with designers' logic errors, like NPCs frozen in a T-pose.
There's also the physical simulation, rendering, level geometry and animation processing, and the game's debug systems. And it's right here, precisely because of the large volume of data — for instance when you need to collect and save all data from every model in the scene every frame for later analysis and debugging — that many good reasons appear to spend time optimizing code. Or allocation-tracking systems that track every memory allocation and deallocation during runtime. And it's exactly in such debug systems that attention is paid to low-latency code, which is irrelevant for general-purpose applications. Something similar exists in high-frequency trading (HFT) or queueing systems, but only there do the saved cycles bring real profit or cut the cost of running the hardware.
In gamedev, though, we learn to value human time — the time of the designer who launches a game scene hundreds of times a day while tuning or polishing the game AI. The time of the programmer, who along with a bug receives not only a stacktrace, a dump and maybe a bug description, but also a replay of the scene from two minutes before the bug; the dump is about twenty gigabytes, the replay another twenty or so — except the replay contains a minidump of every frame, as I wrote above, for the last two minutes. And here small wins and optimizations turn into minutes of real time spent unpacking and processing huge volumes of data (huge within a single PC), which demands extremely fast algorithms and sometimes assorted tricks and hacks. And what's the most powerful thing we have for shooting bits at our bugs' feet? C++, of course.
What this article is about
Many of the optimizations listed below are fairly obvious, such as pre-warming caches, using constexpr, loop unrolling and inlining. Other patterns are less obvious, such as the hotpath, branch trimming, isolating rarely executed code, getting rid of logs, training the branch predictor.
And there are also interesting moments around signed vs unsigned comparison, mixing floating-point types, and various lock-free programming methods, such as using a ring buffer. I won't touch unaligned memory access in this article — first, it was already covered here, and second, it's a topic for a separate article and has been covered on Habr more than once. When micro-optimizations save minutes of real time, maybe they're no longer micro? And of course, to everyone who wants to wield this article in their arguments — please profile these spots first; a profiler is probably the only reliable source of such optimizations, and even then not always.
Warming cache
Needed to minimize memory access time and improve algorithm responsiveness. To do this, data is loaded into the core's cache in advance, before it's actually used. Use it with caution, because with your hammer-fingers you can quite easily break the branch predictor — locally win 5% of performance but break the neighboring algorithm and lose more there. From experience optimizing on real data, it works on objects whose size doesn't exceed 4× the cache line size; beyond that, speed degrades and the warming cost starts to affect the algorithm itself.
Benchmark code
constexpr int kSize = 20000000;
std::vector<int> cache_data_cold(kSize);
std::vector<int> cache_indices_cold(kSize);

std::vector<int> cache_data_warm(kSize);

static void BM_CacheDataCold(benchmark::State& state) {
  // Random indices to avoid auto prefetching next lines to cache
  for(auto& index : cache_data_cold) {
    index = (index * 3 + 1) % kSize;
  }

  for (auto _ : state) {
    int sum = 0;
    // Access data random, cache missing guarantee
    for (const auto &idx: cache_indices_cold) {
      benchmark::DoNotOptimize(sum += cache_data_cold[idx]);
    }
    benchmark::ClobberMemory();
  }
}
BENCHMARK(BM_CacheDataCold);

static void BM_CacheDataWarm(benchmark::State& state) {
  // Linear accessing data in sequential order, that use common cpu algoritms cache prefetching
  int sum_warm = 0;
  for (const auto &i: cache_data_warm) {
    benchmark::DoNotOptimize(sum_warm += i);
  }
  benchmark::ClobberMemory();

  // Run benchmark body
  for (auto _ : state) {
    int sum = 0;
    // Access data in sequential order again
    for (const auto &i: cache_data_warm) {
      benchmark::DoNotOptimize(sum += i);
    }
    benchmark::ClobberMemory();
  }
}
BENCHMARK(BM_CacheDataWarm);
Run on (24 X 4293 MHz CPU s)
CPU Caches:
L1 Data 32 KiB (x12)
L1 Instruction 32 KiB (x12)
L2 Unified 2048 KiB (x12)
L3 Unified 32768 KiB (x4)
-----------------------------------------------------------
Benchmark Time CPU Iterations
-----------------------------------------------------------
BM_CacheDataCold 33812905 ns 36281250 ns 20
BM_CacheDataWarm 24459255 ns 25250000 ns 24
A war story: a game uses A* Jump to compute the path between two points; every frame, for all dynamic objects in the scene, the path is recomputed from the current position taking environment changes into account. The algorithm works with a bounded array of ints that represent the distance from the center of the map to the entry point, used by a directional heuristic that gets called to evaluate which way it's better to search at every step. By pre-walking every 8th element of the array, we get almost the whole array loaded into the L3 cache; the full run of the algorithm takes nearly 4ms per frame for 8k objects on the map. Profiling revealed almost 70% misses, which left the algorithm idling while waiting for data; warming the cache reduced the run time to almost 1.5ms. The game is under the spoiler.
Game under spoiler

Ymir
Compile-time dispatch
Using techniques like template specialization or function overloading, you can optimize execution paths at compile time, which lets you avoid runtime branching and reduce the number of preemptive speculative-branch computations in the core. It's used often, not only to optimize runtime but also to improve code structure. But, I repeat, you shouldn't replace an if with specialization or other tricks without a clear understanding of the consequences. The lowest graphs and the best times came from giving up dynamic object creation, which sort of tells us the conditional execution isn't the culprit — yet conditional branches still take their 5% of perf.
Benchmark code
class Function {
public:
  virtual ~Function() {}
  virtual int result() const = 0;
};

class Function1 : public Function {
public:
  int result() const override { return 1; }
};

class Function2 : public Function {
public:
  int result() const override { return 2; }
};

// Benchmark for runtime dispatch
static void BM_RuntimeFunction(benchmark::State& state) {
  Function* obj = state.range(0) == 1 ? (Function*)new Function1 : (Function*)new Function2;

  for (auto _ : state) {
    benchmark::DoNotOptimize(obj->result());
  }

  delete obj;
}
BENCHMARK(BM_RuntimeFunction)->Arg(1)->Arg(2);

template <typename T>
static void BM_CompileTimeFunctionNew(benchmark::State& state) {
  T *obj = new T;
  for (auto _ : state) {
    benchmark::DoNotOptimize(obj->result());
  }

  delete obj;
}
BENCHMARK_TEMPLATE(BM_CompileTimeFunctionNew, Function1);
BENCHMARK_TEMPLATE(BM_CompileTimeFunctionNew, Function2);

// Benchmark for compile-time dispatch
template <typename T>
static void BM_CompileTimeFunction(benchmark::State& state) {
  T obj;
  for (auto _ : state) {
    benchmark::DoNotOptimize(obj.result());
  }
}
BENCHMARK_TEMPLATE(BM_CompileTimeFunction, Function1);
BENCHMARK_TEMPLATE(BM_CompileTimeFunction, Function2);
A war story: the effects manager used function overloading of the draw routine for different object types — sparks, splashes, grains of sand, dust, etc. On the PC build there were no problems; on a powerful (4GHz) processor it all chewed through instantly. When porting to the Nintendo Switch, the quirks of the weak (800MHz) processor showed up — it couldn't grind it all in time on busy scenes. First we tried cutting the number of effects, but the picture started to look poor. After profiling it turned out 7% of the run time went on stepping through the ifs, something like 50 branches, and another ~10% went on calling the overloaded function. Preparing effects for drawing on the console took 5ms per frame; after getting rid of the branching and the virtual function calls we were able to bring back almost all of the effects from the PC version and cut the time to 3ms. The game is under the spoiler.
Game under spoiler

Blades Of Time (NX port)
Loop unrolling
Loops are unrolled at compile time to reduce control overhead and improve performance, especially for small loops with a known iteration count. Use with caution — compilers are smart enough and unroll loops themselves where possible, and you can't always analyze and see that a given piece of code can be optimized this way without checking it with a profiler. The method has limited applicability and works best on linear arrays with simple data; the greater the distance between the array elements you need to access, the smaller the performance gain. Still, if the offset pattern is determined by the processor or the programmer, that's reason enough to analyze and rework the current piece of code — and don't forget to use a profiler.
Benchmark code
static void BM_RawLoopLogic(benchmark::State& state) {
  for (auto _ : state) {
    int result = 0;
    for (int i = 0; i < state.range(0); ++i) {
      result += i;
    }
    benchmark::DoNotOptimize(result);
  }
}
BENCHMARK(BM_RawLoopLogic)->Arg(1000);

static void BM_UnrolledLoopLogic(benchmark::State& state) {
  for (auto _ : state) {
    int result = 0;
    for (int i = 0; i < state.range(0); i += 4) {
      result += i + (i + 1) + (i + 2) + (i + 3);
    }
    benchmark::DoNotOptimize(result);
  }
}
BENCHMARK(BM_UnrolledLoopLogic)->Arg(1000);
---------------------------------------------------------------------------
Benchmark Time CPU Iterations
---------------------------------------------------------------------------
BM_RawLoopLogic/1000_mean 540 ns 541 ns 20
BM_RawLoopLogic/1000_median 539 ns 547 ns 20
BM_UnrolledLoopLogic/1000_mean 171 ns 171 ns 20
BM_UnrolledLoopLogic/1000_median 171 ns 173 ns 20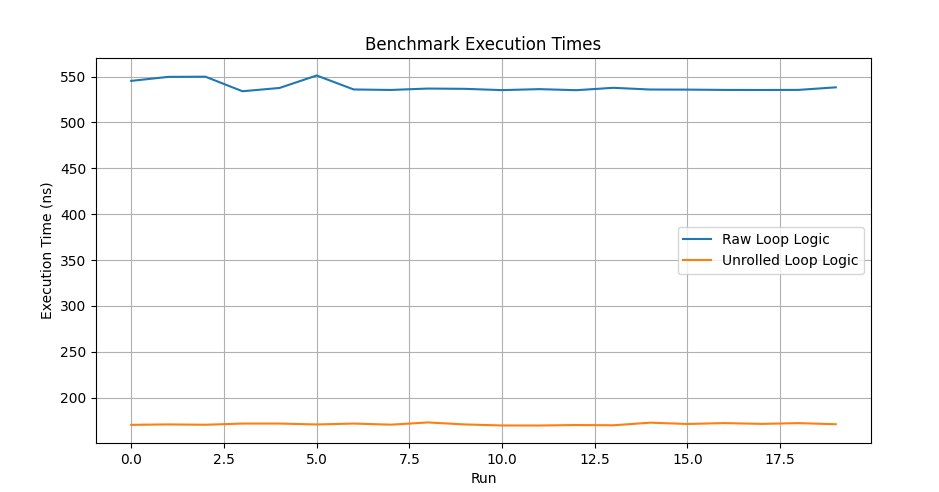
A war story: back when clang/msvc didn't optimize so aggressively, we had to resort to such tricks to make a game run on weak devices. The game was written in Marmalade and targeted the iPhone 6, but at some point we decided to bring joy to the iPhone 5 crowd and even take a swing at the 4s. The 5 somehow coped, putting out 23–25 fps — playing wasn't exactly comfortable but possible — while the 4 couldn't go above 20 fps at all. We got 23 fps by lowering model quality, but there was nowhere left to lower it, since it was already mush. The profiler showed that a great many spots optimize well with loop unrolling; first we tried finding them by hand, then we gave up on that thankless task and, with the help of Python, macros, scripts and some choice words, went through the entire Marmalade codebase and partially unrolled the loops. Not without pain, but after a week of filework the coveted two fps were obtained, and we reached 25 fps for App Store approval. The game is under the spoiler.
Game under spoiler

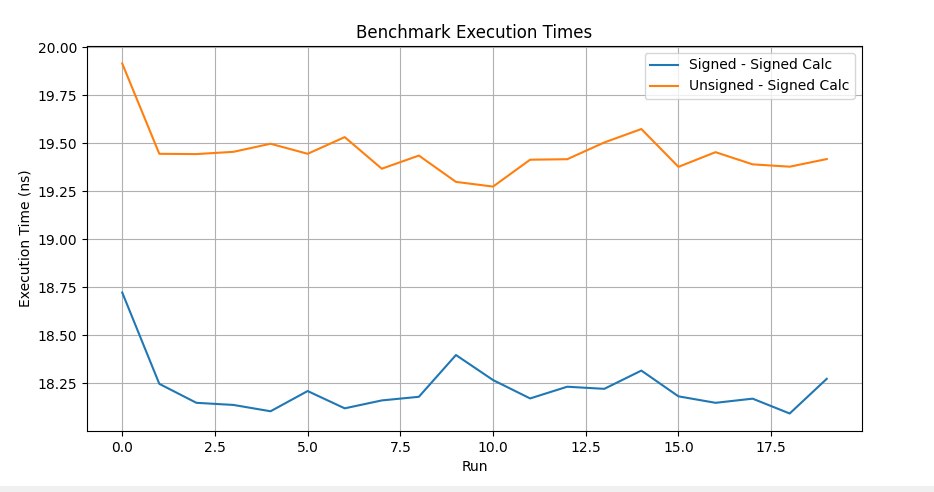
Signed/Unsigned operand matching
Sign consistency in comparisons lets you avoid the performance problems tied to conversion to a common type, and supports the use of more efficient instructions during code generation. On the other hand, what's a 1ns difference over a million operations when our 4K textures load in milliseconds. The rule of using sign-consistent operands came from the PlayStation 3 era, with its very wayward Cell processor — powerful, but in some respects hard to optimize — where using such operands led to heavy assembly instructions converting one type to another. Caught by special compilation flags on almost all compilers. You won't run into this on modern hardware anymore, right?
Benchmark code
int func_signed_signed(int i) {
    int j = 0;
    for (signed k = i; k < i + 10; ++k) {
        ++j;
    }
    return j;
}

int func_unsigned_signed(int i) {
    int j = 0;
    for (unsigned k = i; k < i + 10; ++k) {
        ++j;
    }
    return j;
}

static void BM_SignedSigned(benchmark::State& state) {
    for (auto _ : state) {
        int i = rand() % 5;
        volatile int result = func_signed_signed(i);
    }
}

static void BM_UnsignedSinged(benchmark::State& state) {
    for (auto _ : state) {
        int i = rand() % 5;
        volatile int result = func_unsigned_signed(i);
    }
}
-------------------------------------------------------------------
Benchmark                         Time             CPU   Iterations
-------------------------------------------------------------------
BM_SignedSigned (med)          18.7 ns         18.8 ns     37333333
BM_UnsignedSigned (med)        19.2 ns         19.3 ns     37333333
Float/Double operand matching
Consistency of float and double types in computations prevents implicit type conversions, potential precision loss and execution slowdown. These are hard-to-catch examples of perf sag on seemingly simple, everyday operations, often undetectable because they're smeared across the code. Caught by special compilation flags and by searching the assembly listing for functions with certain signatures. And while you can maybe turn one blind eye to execution speed, with precision loss it's much worse — errors from such code accumulate over an interval of several seconds, even minutes, causing induced errors in completely random places.
Benchmark code
static void BM_FloatDouble(benchmark::State& state) {
    for (auto _ : state) {
        float a, b = rand();
        a = b * 1.23;
    }
}
// Register the function as a benchmark
BENCHMARK(BM_FloatDouble);

static void BM_FloatFloat(benchmark::State& state) {
    for (auto _ : state) {
        float a, b = rand();
        a = b * 1.23f;
    }
}
BENCHMARK(BM_FloatFloat);
Let me explain a bit what happens in the benchmark: mixing float and double types leads to a small runtime cost due to the need to convert all types to a more general one across the whole expression. If a computation involves both float and double, implicit conversions of the float variable to a double variable (which has higher precision) are required; the result, represented as double(a * 1.23), is then demoted back to float, with precision loss and error accumulation, to match the original type of the variable. These operations add overhead to the simplest code, and the compiler obligingly does this transparently for the programmer. Meanwhile, conversions between float and double are fairly complex, even though implemented at the level of the processor's microcode, and can affect execution time — especially when such operations happen inside loops or are part of the signature of a called function. On modern processors the cost of such conversions may be insignificant for individual operations, all the more so when they're smeared across the whole execution stream.
----------------------------------------------------------------
Benchmark                      Time             CPU   Iterations
----------------------------------------------------------------
BM_FloatDouble              18.6 ns         18.7 ns     37333333
BM_FloatFloat               18.3 ns         18.4 ns     37333333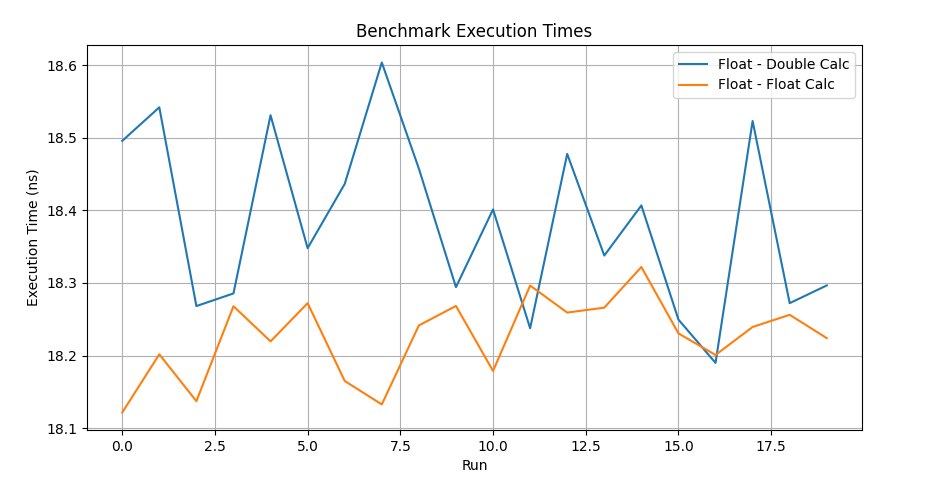
A war story: using signed/unsigned operands in loop statements and mixing float/double led to suboptimal operations on the Nintendo Switch, which the compiler happily reported — but for a while we ignored those warnings. Before the game's release we decided to fix the warnings and got +2 FPS and a stable 30 in handheld mode. It turned out some were in critical spots in the renderer; on x86 it had no effect, but on the Switch's weak hardware it very much did. The game is under the spoiler.
Reducing branch complexity (Branch Prediction Poison)
Conditional branch prediction lets code execute speculatively, and modern processors are good at it. But not always — for example, the Cell on the PlayStation 3 had a terrible branch predictor, and the losses from running in speculative-execution mode were up to 10%, i.e. turning that mode off on the CPU increased game performance — or you just learned all sorts of tricks. By reducing the number of branches you get a leaner execution logic (not always more readable), get rid of branches and multiply the algorithm's performance. This is achieved with math tricks, data structures suited to the algorithm, caching results, analyzing execution paths and using the profiler in unusual ways.
Benchmark code
bool long_way_condition(int i) {
  for (int j = 0; j < 10000; ++j) {
    benchmark::DoNotOptimize(j);
  }
  return i % 2 == 0;
}

bool short_way_condition(int i) {
  return i % 2 != 0;
}

static void BM_LongConditionFirst(benchmark::State& state) {
  for (auto _ : state) {
    bool result = false;
    for (int i = 0; i < state.range(0); ++i) {
      result = long_way_condition(i) || short_way_condition(i);
    }
    benchmark::DoNotOptimize(result);
  }
}
BENCHMARK(BM_LongConditionFirst)->Range(8, 8<<10);

static void BM_ShortConditionFirst(benchmark::State& state) {
  for (auto _ : state) {
    bool result = false;
    for (int i = 0; i < state.range(0); ++i) {
      result = short_way_condition(i) || long_way_condition(i);
    }
    benchmark::DoNotOptimize(result);
  }
}
BENCHMARK(BM_ShortConditionFirst)->Range(8, 8<<10);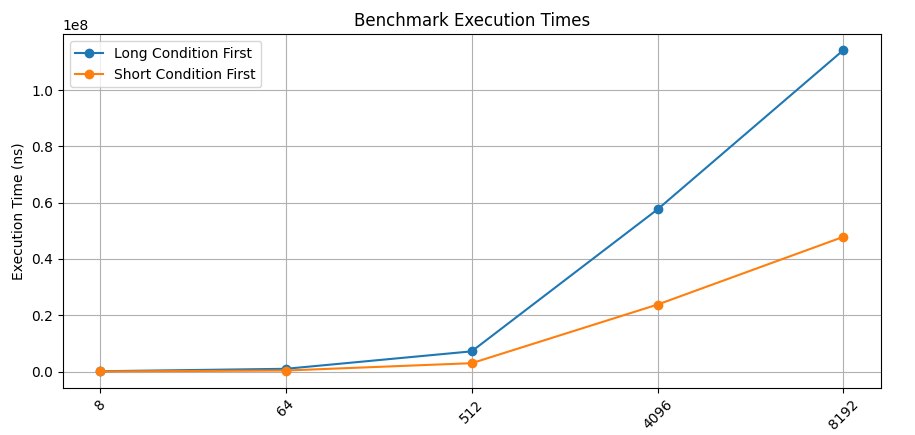
Branch optimization (Slowpath Removal)
An optimization technique aimed at minimizing calls into rarely used pieces of code within the execution stream. Some of my colleagues lump this into the previous point, but I broke it out into a separate section. This case includes, for example, debug and diagnostic log messages, which by their nature run very rarely but substantially affect the overall code structure, hampering the work of code optimizers. In the example below, saving a (potentially slow) error in hot code is replaced with putting it into an intermediate buffer that can be processed in a neighboring thread or separately after the main algorithm finishes. This didn't affect the algorithm itself, but the slow part was removed from the fast code; and although it was called only 10% of the time, it slowed the whole algorithm by roughly 3×. This is a synthetic example that draws attention to the problem, but using, for instance, error logging inside "hot" algorithms can drastically affect their speed even if such an error happens in 1% of cases.
Benchmark code
static std::map<int, int> orders;
static bool okay = false;

static std::vector<int> errors;

static void save_error_in_report(const std::string& message) {
  for (volatile int i = 0; i < 10000; ++i) {
    benchmark::DoNotOptimize(i);
  }
}

static void removeFromMap(int orderId, std::map<int, int>& orders) {
  orders.erase(orderId);
}

static void log(const std::string& message) {
  for (volatile int i = 0; i < 10000; ++i) {
    benchmark::DoNotOptimize(i);
  }
}

static void __declspec(noinline) HandleError() {
  errors.push_back((int)"Some errors");
  removeFromMap(1, orders);
  log("Some error");
}

// Bad scenario.
static void NoHotpath(benchmark::State& state) {
  int counter = 0;
  for (auto _ : state) {
    okay = (++counter % 10 != 0); // 90% of the exec
    if (okay) {
      // Hotpath
    } else {
      save_error_in_report("Some errors");
      removeFromMap(1, orders);
      log("Some errors");
    }
  }
}
BENCHMARK(NoHotpath);

static void UsingHotpath(benchmark::State& state) {
  int counter = 0;
  for (auto _ : state) {
    okay = (++counter % 10 != 0); // 90% of the exec
    if (okay) {
      // Hotpath.
    } else {
      HandleError();
    }
  }
}
BENCHMARK(с);
-----------------------------------------------------------
Benchmark Time CPU Iterations
-----------------------------------------------------------
NoHotpath 15758 ns 15868 ns 14352
UsingHotpath 10597 ns 10798 ns 24578Branch prediction and speculative execution became one of the growth points of CPU performance, and the predictor can take up the most space on the die. If the prediction is accurate, it lets the processor load instructions from memory before they're actually used, leading to more efficient execution.
On the other hand, an incorrect branch prediction leads to a situation where the processor will stall until the correct instructions and data are loaded from cache, and in the worst case from main memory. Given the importance of such capabilities in processors, compilers have also gained branch-hint instructions at compile time, such as __builtin_expect in clang. These hints may steer the compiler toward more optimal code structures — or may not.
Benchmark code
int errorCounterA = 0;

bool check_for_error_a() {
    // Produce an error once every 10 calls
    errorCounterA++;
    for (int j = 0; j < 10000; ++j) {
        benchmark::DoNotOptimize(j);
    }
    return (errorCounterA % 10) == 0;
}

bool check_for_error_b() {
    for (int j = 0; j < 10000; ++j) {
        benchmark::DoNotOptimize(j);
    }
    return false;
}

bool check_for_error_c() {
    for (int j = 0; j < 10000; ++j) {
        benchmark::DoNotOptimize(j);
    }
    return false;
}

void handle_error_a() {
    for (int j = 0; j < 10000; ++j) {
        benchmark::DoNotOptimize(j);
    }
}

void handle_error_b() {
    for (int j = 0; j < 10000; ++j) {
        benchmark::DoNotOptimize(j);
    }
}

void handle_error_c() {
    for (int j = 0; j < 10000; ++j) {
        benchmark::DoNotOptimize(j);
    }
}

void execute_hot_path() {
    for (int j = 0; j < 10000; ++j) {
        benchmark::DoNotOptimize(j);
    }
}

static void Branching(benchmark::State& state) {
    errorCounterA = 0;
    for (auto _ : state) {
        if (check_for_error_a())
            handle_error_a();
        else if (check_for_error_b())
            handle_error_b();
        else if (check_for_error_c())
            handle_error_c();
        else
            execute_hot_path();
    }
}

// A new setup using flags
enum ErrorFlags {
    ErrorA = 1 << 0,
    ErrorB = 1 << 1,
    ErrorC = 1 << 2,
    NoError = 0
};

int errorCounterFlags = 0;

ErrorFlags checkErrors() {
    errorCounterFlags++;
    return (errorCounterFlags % 10) == 0 ? ErrorA : NoError;
}

void HandleError(ErrorFlags errorFlags) {
    if (errorFlags & ErrorA) {
        handle_error_a();
    }
}

void hotpath() {
    for (int j = 0; j < 10000; ++j) {
        benchmark::DoNotOptimize(j);
    }
}

static void ReducedBranching(benchmark::State& state) {
    errorCounterFlags = 0;
    for (auto _ : state) {
        ErrorFlags errorFlags = checkErrors();
        if (errorFlags)
            HandleError(errorFlags);
        else
            hotpath();
    }
}

BENCHMARK(Branching);
BENCHMARK(ReducedBranching);
Moreover, an important approach here is to isolate error handling from the main executed part of the code (the hotpath), thereby reducing the number of branches and the opportunities for misprediction.
-----------------------------------------------------------
Benchmark                 Time             CPU   Iterations
-----------------------------------------------------------
Branching             51858 ns        50815 ns        14452
LessBranching         10597 ns        10498 ns        64000
A bit more on this topic here.
A war story: a fairly well-known engine and project; a matrix multiplication function called tens of thousands of times per frame (any rotation of any bone on a skeleton is at least one matrix multiply), optimized to the hilt — if not for these five lines of code at the start that kill all the optimizations. Cut all the excess and voilà, +3 fps out of thin air, pure magic. The game's in the attachment; the engine, I think, you'll recognize.
matrix3f& matrix3f::mul (const matrix3f& ma, const matrix3f& mb)    {
    assertq  (this);
    assertq  (&ma);
    assertq  (&mb);

    assertq  (this != &ma);
    assertq  (this != &mb);

    _1.m =  sse_add(sse_add(sse_add(sse_mul(sse_shfll(ma._1.m, ma._1.m, _MM_SHUFFLE(0,0,0,0)), mb._1.m), sse_mul(sse_shfll(ma._1.m, ma._1.m, _MM_SHUFFLE(1,1,1,1)), mb._2.m)), sse_mul(sse_shfll(ma._1.m, ma._1.m, _MM_SHUFFLE(2,2,2,2)), mb._3.m)), sse_and(ma._1.m, MM_000f_PS));
    _2.m =  sse_add(sse_add(sse_add(sse_mul(sse_shfll(ma._2.m, ma._2.m, _MM_SHUFFLE(0,0,0,0)), mb._1.m), sse_mul(sse_shfll(ma._2.m, ma._2.m, _MM_SHUFFLE(1,1,1,1)), mb._2.m)), sse_mul(sse_shfll(ma._2.m, ma._2.m, _MM_SHUFFLE(2,2,2,2)), mb._3.m)), sse_and(ma._2.m, MM_000f_PS));
    _3.m =  sse_add(sse_add(sse_add(sse_mul(sse_shfll(ma._3.m, ma._3.m, _MM_SHUFFLE(0,0,0,0)), mb._1.m), sse_mul(sse_shfll(ma._3.m, ma._3.m, _MM_SHUFFLE(1,1,1,1)), mb._2.m)), sse_mul(sse_shfll(ma._3.m, ma._3.m, _MM_SHUFFLE(2,2,2,2)), mb._3.m)), sse_and(ma._3.m, MM_000f_PS));

    return *this;
};
That very macro
#define assertq(expr) {
   if (!(expr)) { ::log_fail(context_); ::debug_fail(#expr,__FILE__,, __LINE__); } } ::create_crashdump_func()
Game under spoiler

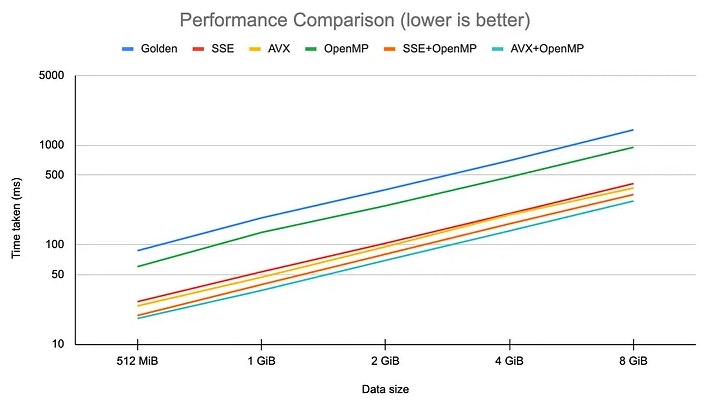
Algorithm vectorization (SIMD logic)
Single-instruction, multiple-data (SIMD) operations let you multiply the local performance of algorithms, significantly speeding them up with vector and matrix computations. One of the most in-demand paths of algorithm optimization, lying literally under developers' feet, which they unfortunately prefer not to notice, looking instead toward beefier processors and faster RAM.
Benchmark code
size_t sse42_strlen(const char* s) {
    size_t result = 0;

    __m128i* mem = reinterpret_cast<__m128i*>(const_cast<char*>(s));
    const __m128i zeros = _mm_setzero_si128();

    for (/**/; /**/; mem++, result += 16) {

        const __m128i data = _mm_loadu_si128(mem);

        const uint8_t mode =
            _SIDD_UBYTE_OPS |
            _SIDD_CMP_EQUAL_EACH |
            _SIDD_LEAST_SIGNIFICANT;

        if (_mm_cmpistrc(data, zeros, mode)) {
            const auto idx = _mm_cmpistri(data, zeros, mode);

            return result + idx;
        }
    }
}

static void BM_NativeStrlen(benchmark::State& state) {
    std::string xstr("yyyyyyyyyyyyyyyyyyyyyyyyyyyyyyyyyyyyyyyyyyyyyyyyyyyyyyyyyyyyyyyyyy");
    for (auto _ : state) {
        int x = strlen(xstr.c_str());
        benchmark::DoNotOptimize(xstr);
        benchmark::DoNotOptimize(x);
    }
}
BENCHMARK(BM_NativeStrlen);

static void BM_SseStrlen(benchmark::State& state) {
    std::string xstr("yyyyyyyyyyyyyyyyyyyyyyyyyyyyyyyyyyyyyyyyyyyyyyyyyyyyyyyyyyyyyyyyyy");
    for (auto _ : state) {
        int x = sse42_strlen(xstr.c_str());
        benchmark::DoNotOptimize(xstr);
        benchmark::DoNotOptimize(x);
    }
}
BENCHMARK(BM_SseStrlen);
The performance test focuses on a purely practical example, a function to get the length of a string — the native one from the library and one optimized using SSE4.2 instructions: the native function searches for the end of the string by iterating over every character starting from zero, while the second uses SIMD instructions to search across sixteen bytes at once per call.
----------------------------------------------------------
Benchmark                Time             CPU   Iterations
----------------------------------------------------------
BM_NativeStrlen       29.3 ns         29.5 ns     24888889
BM_SseStrlen          5.06 ns         5.10 ns    119466667
The screenshot shows representative timings for comparing a block of data using various approaches.
A war story: we sadly can't get away from configs, and the desire to make the editor responsive to file changes or to add hotreload leads to having to work with strings on level load — comparing them and processing them somehow — which led to creating optimized functions where it's all packed into SSE instructions. The result wasn't long in coming: level load time in the editor dropped from 8 to 5 minutes.
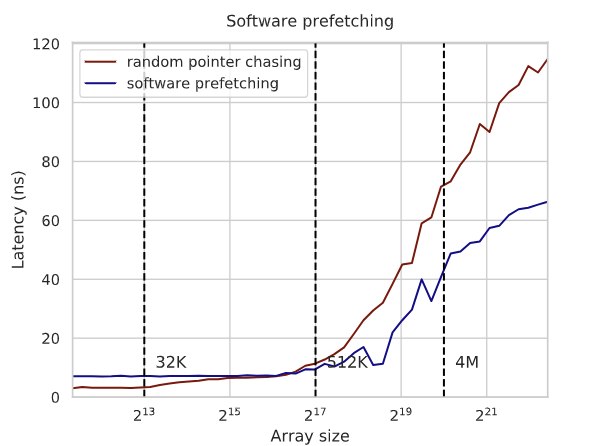
Data prefetching
Explicitly loading data into the cache, and designing algorithms to actively use the processor's cache, before that data is used helps reduce data-fetch latency, especially in memory-bound applications.
Benchmark code
void NoPrefetch(benchmark::State& state) {
    int range = state.range(0);
    std::vector<int> data(range, 1);
    for (auto _ : state) {
        long sum = 0;
        for (int i = 0; i < range;) {
            sum += data[i];
            i += 64 + rand() % 5;
        }
        benchmark::DoNotOptimize(sum);
    }
}
BENCHMARK(NoPrefetch)->Arg(5<<20);

void WithPrefetch(benchmark::State& state) {
    int range = state.range(0);
    std::vector<int> data(range, 1);
    auto *ptr = data.data();
    for (auto _ : state) {
        long sum = 0;
        int prefetch_distance = 64;
        int i = 0;

        for (int i = 0; i < range;) {
            sum += data[i];
            i += 64 + rand() % 5;
            _mm_prefetch(reinterpret_cast<const char*>(ptr + i),
                         _MM_HINT_T0);
        }
        benchmark::DoNotOptimize(sum);
    }
}
BENCHMARK(WithPrefetch)->Arg(5<<20);
Prefetching is a hint to the processor (which it may disregard) to improve execution performance, consisting of specifying in advance the addresses that will be accessed. Processors use this data differently: Intel, for instance, actually loads it into the L1/L2 caches; AMD adds those addresses to the predictor, and when the processor needs the data it will already be available in one of the caches rather than loaded from slower main memory.
Prefetching reduces latency and the time spent on data-fetch operations, allowing more efficient use of the processor's execution capabilities. This optimization is used in algorithms where data access patterns are predictable — for example, traversing arrays with a variable but known stride, matrix operations, or accessing a class's data when it's expected to be heavily used but isn't within a few cache lines.
---------------------------------------------------------------
Benchmark                     Time             CPU   Iterations
---------------------------------------------------------------
NoPrefetch/5242880      6829454 ns      6835938 ns          112
WithPrefetch/5242880    3624027 ns      3613281 ns          160
Here you can read about a cache-friendly associative container, and about the same thing, the effect of prefetching on search time in a linear array.
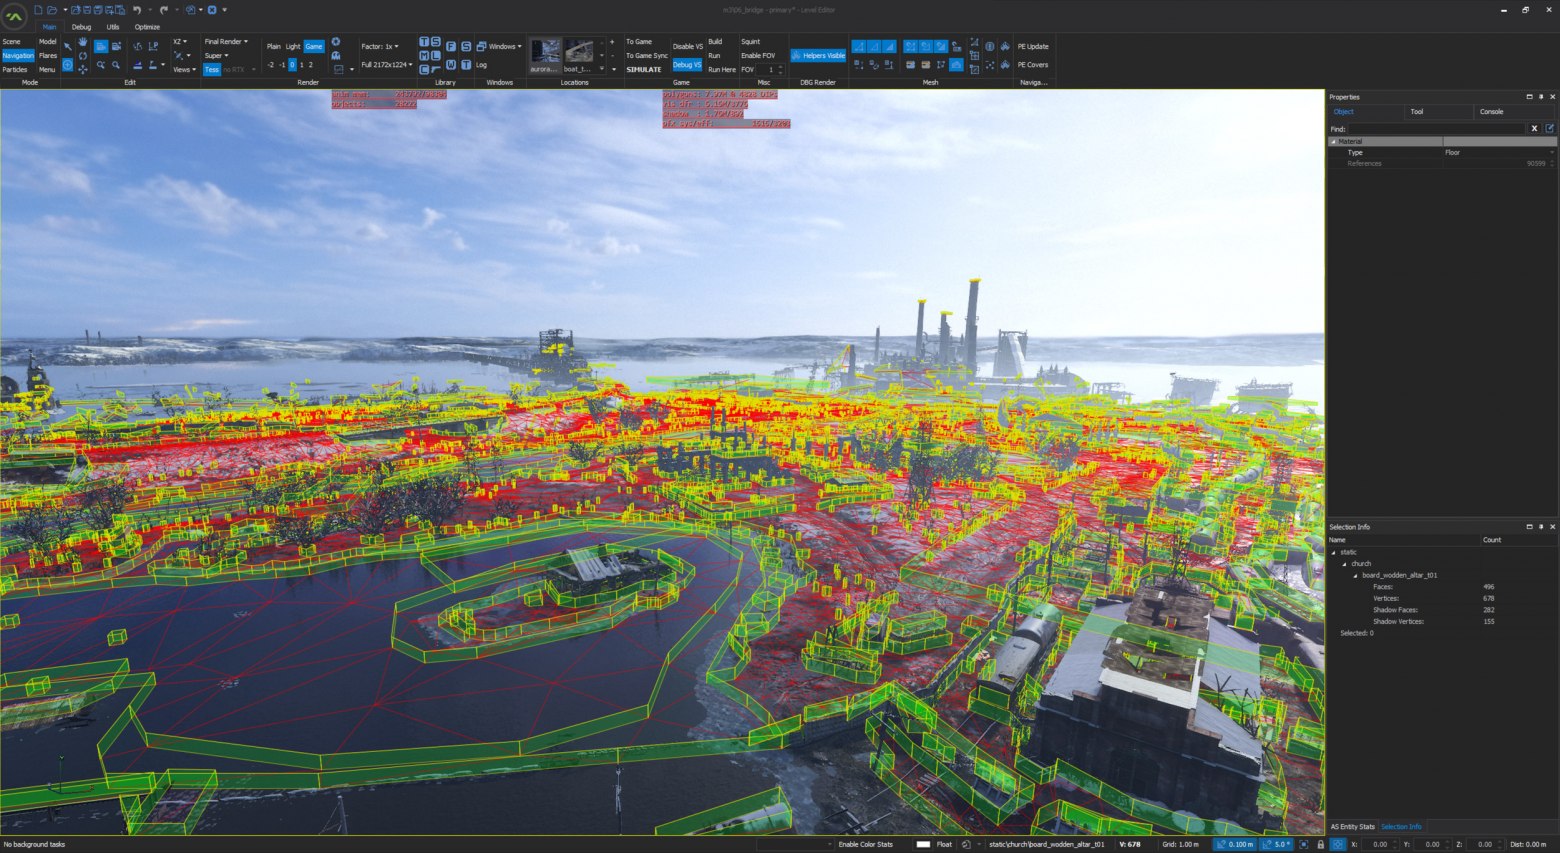
A war story: all those multicolored colors in the screenshot below are scene objects living in a linear array of size 65k. Objects of arbitrary type, from effects to character models and props. Each object has a set of components and properties, dozens of them. The structure sizes in memory are tens of kilobytes, so no cache is enough. Applying filters and searching for objects in the scene becomes a costly task that takes seconds of real time; knowing the addresses to be accessed next and being able to load that data into the cache before accessing it reduces search time to hundreds of milliseconds.
Scene screenshot
Constexpr computations
Computations marked as constexpr are performed at compile time, which lets constants and computations be done efficiently offline, eliminating runtime computation. Our engine uses a whole library with a large number of commonly used math and trigonometric functions. In the engine it's used wherever possible, moving all runtime computations into constants. The classic example is computing a factorial, but it can be any code in principle — for instance computing checksums, or cos(34*) as constants.
Benchmark code
constexpr int factorial(int n) {
    return (n <= 1) ? 1 : (n * factorial(n - 1));
}

int runtime_factorial(int n) {
    return (n <= 1) ? 1 : (n * runtime_factorial(n - 1));
}

static void BM_ConstexprFactorial(benchmark::State& state) {
    for (auto _ : state) {
        constexpr int factorial_10 = factorial(10);
        benchmark::DoNotOptimize(factorial_10);
    }
}
BENCHMARK(BM_ConstexprFactorial);

static void BM_RuntimeFactorial(benchmark::State& state) {
    for (auto _ : state) {
        const int factorial_10 = runtime_factorial(10);
        benchmark::DoNotOptimize(factorial_10);
    }
}
BENCHMARK(BM_RuntimeFactorial);
----------------------------------------------------------------
Benchmark Time CPU Iterations
----------------------------------------------------------------
BM_ConstexprFactorial 1.40 ns 1.35 ns 497777778
BM_RuntimeFactorial 18.7 ns 18.8 ns 37333333A war story: I've already told you why the Nintendo Switch SDK has several different implementations of sin; studying the code while porting games to that platform revealed the costliness of using trigonometric functions compared to PC, especially in debug mode. During the rework, first sin/cos were moved into constexpr, then tan/logn, and then basically all the commonly used math functions. Over time a library of math functions formed that can replace constants and part of the runtime computations.
Library code
template<typename T>
constexpr T				cos_impl(const T x) noexcept { return ( T(1) - x * x) / (T(1) + x * x ); }

template<typename T>
constexpr T				_cos(const T x) noexcept {
	return				( _isnan(x)
							? numeric_limits<T>::quiet_NaN()
  						    : (numeric_limits<T>::zero() > ctl::_abs(x))
								? T(1)																		// indistinguishable from 0
							    : (numeric_limits<T>::zero() > ctl::_abs(x - T(const_half_pi)))
									? T(0)																	// special cases: pi/2 and pi
								    : (numeric_limits<T>::zero() > ctl::_abs(x + T(const_half_pi)))
										? T(0)
										: (numeric_limits<T>::zero() > ctl::_abs(x - T(const_pi)))
											? -T(1)
											: (numeric_limits<T>::zero() > ctl::_abs(x + T(const_pi)))
												? -T(1)
												: cos_impl( detail_tan::_tan(x / T(2)) ) );
}
Here you can also read about the evolution of constexpr computations in C++ from PVS.
Lock-free algorithms
Lock-free programming is a multithreaded programming paradigm focused on creating a distinct kind of algorithm that doesn't use synchronization mechanisms to access shared resources. The key concept of this approach is the use of atomic operations, which either fully execute or don't execute in a single processor operation and are able to guarantee the integrity of their state across multiple threads. This eliminates deadlocks, livelocks and other problems that arise when using synchronization primitives. From experience using it in real projects, I managed to apply it a few times; the gain wasn't very large, and it added a fair number of bugs. Often using a mutex is much cheaper and faster, unless of course you're extracting billions of records from a dump.
Benchmark code
std::atomic<int> atomic_counter;
std::mutex counter_mutex;
int locked_counter;

void atomic_inc(int inc) {
    for (int i = 0; i < inc; ++i) {
        atomic_counter++;
    }
}

void mutex_inc(int inc) {
    for (int i = 0; i < inc; ++i) {
        std::lock_guard<std::mutex> lock(counter_mutex);
        locked_counter++;
    }
}

static void BM_AtomicInc(benchmark::State& state) {
    for (auto _ : state) {
        atomic_inc(state.range(0));
    }
}

BENCHMARK(BM_AtomicInc)->Arg(10000);

static void BM_MutexInc(benchmark::State& state) {
    for (auto _ : state) {
        mutex_inc(state.range(0));
    }
}
BENCHMARK(BM_MutexInc)->Arg(10000);
Using atomic operations to achieve parallelism in algorithms without locks eliminates the overhead and potential blocking associated with synchronization primitives. A very slippery topic, because writing lock-free code is fairly hard, accounting for all the cases where it won't work is even harder, and the profit from parallelizing such an algorithm shrinks when you use patterns like partial processing.
-------------------------------------------------------------
Benchmark Time CPU Iterations
-------------------------------------------------------------
BM_AtomicInc/10000 51188 ns 50815 ns 14452
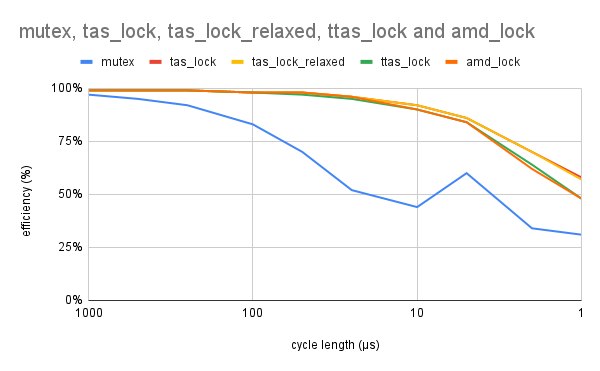
BM_MutexInc/10000 164190 ns 163240 ns 3733The picture shows the probability of acquiring the lock, for a mutex and various spinlock variants, as a function of the time between attempts. And here's a good article on a lock-free map.
A war story: on one project, even before gamedev, the volume of data coming from hardware could be several tens of millions of homogeneous objects — POD data, the objects could reference each other, all objects arrived in bulk and were deleted the same way. Under such conditions, dynamic memory management leads to very large time losses on creating/deleting objects. Without a debugger, creating/processing/deleting happened in a few seconds, but under the IDE freeing memory slowed down so much that debugging became simply unrealistic. Besides time, due to the large number of allocations, the memory spent on the allocator's bookkeeping data became noticeable. To work with this type of object we made a special lock-free container with a BumpAllocator that allocated memory in large segments and placed objects there by index. The object count is guaranteed to be under 65 million; each thread got its own segment in which processing and data placement happened. On x64, allocating 60 million elements across 12 threads with such an allocator took about 400ms on an i7 3GHz, and freeing 170ms. Allocating with new took about 2000ms.
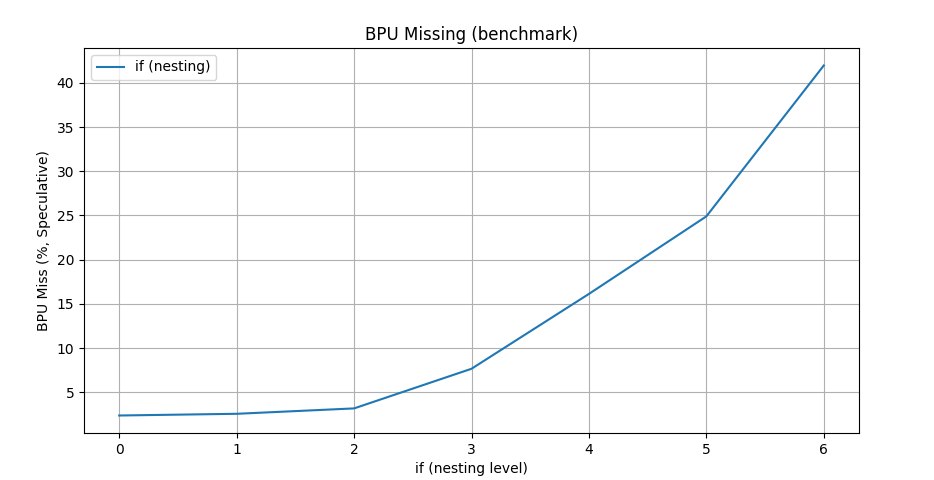
Training the branch predictor (Warming BPU)
In theory you can run, before the main algorithm, a simple training one that contains all the main branches of the big algorithm. Having tuned the BPU into the appropriate configuration, you can then run the algorithm with data, and it will run faster. There's a very interesting article on this topic. A debatable optimization — I've only had a couple of cases in practice where this kind of micro-optimization was needed, and on one algorithm and hardware it worked, on another it didn't. I never managed to come up with a good benchmark example, so if you have suggestions, write in the comments and I'll add to the article with attribution.
Function inlining
The compiler includes the entire function body at every call site, reducing the function-call overhead and letting the compiler perform further optimization. Sounds good on paper, but in practice it runs into a lot of limitations, such as the size of the inlining block, the size of the inlined function body itself, and bloat of the executable. Again a debatable recommendation, because the compiler is far more "aware of what it compiled there" than any optimizer between your ears, and accounts for many factors a human may not suspect — such as the call frequency of a function, the internal instruction volume and their dependencies.
A war story: we even ran an experiment once, simply turning off all inlining via a macro — on the profiler the changes were within the margin of error, and even the code of the functions we picked for analysis didn't change. Except for a few especially hot spots where we were sure and used __forceinline attributes, everywhere else the compiler handles this task best of all.
Data caching (Short-circuiting cache)
A cache is a hardware or software entity that stores some subset of data (stores it temporarily, or under certain conditions) so that future requests for that data can be served faster. Data accessed recently or frequently will be kept in the cache, and all subsequent reads or writes of that data will be performed significantly faster. Keeping data closer to the processor or to consumers reduces latency and improves the overall efficiency and overall performance of the system. Caches are implemented at various levels of the architecture, but not limited to processors: CPU caches (L1, L2, L3), disk caches, network ones, textures, sounds, models, geometry, etc.
The terms "cache hit" and "cache miss" relate to the efficiency of retrieving data from it. A hit is when a data request can be satisfied by the cache, which removes the need to go to the slower main data store, be it main memory, disk storage or a remote server. This leads to faster response times and lower resource usage for a given data operation. A miss, by contrast, requires fetching data from slower storage to satisfy the current request and update the cache. Cache misses are usually more costly in terms of time and compute resources, but the positive effect of using a cache on the overall architecture more than offsets such costs.
Misses can happen for various reasons, including first access to data (cold start), eviction of data due to size limits, or an inefficient management strategy.
The ratio of hits to total access attempts is often used as the main metric for evaluating the effectiveness of a designed caching system, and the same metric is used in game engines to assess the overall health of systems. Cache occupancy and miss rate indicate the presence of errors in the architecture of the systems that use it.
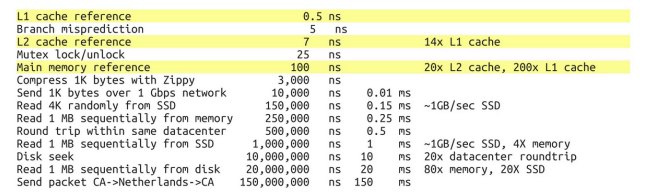
There won't be benchmarks, but here's an instructive picture with average access times to caches of different levels. And a cache can also be poisoned with the wrong data.
A war story: on the Nintendo Switch, due to the specifics of working with the SD card, there's a special class in the SDK called SDFileCache. You give it a file name, and after a callback fires you can start reading the data; while reading and processing is going on, this class prefetches data from the SD card, which lets you read the whole file practically continuously and quickly. If instead you open that file directly on the card and try to read it the same way, you catch freezes as you approach the 256kb boundary — i.e. you read the buffer, the OS dithered, filled it again, you read again. On the profiler this looked like a context switch between threads.
Does all this work?
All these design patterns, optimizations and micro-optimizations were, with varying degrees of success, road-tested on working engines, and I tried to gather them as a list with simple, clear examples. This in no way removes the need to know and apply data structures and algorithms suited to the specific task. No fastest processor will haul an algorithm with O(n!^2). I hope I managed to show you a few paths to improving performance, seemingly already where there's no more perf to squeeze out. And where there were 20 fps, you get 30, and 40, even 60.
← All articles