
We've all had to work on performance, haven't we? It's especially relevant for games — well, maybe some match-3 doesn't suffer from it. As usual there's no silver bullet: we start with data structures and algorithms, go lower, and if that doesn't help we come up with SoA / AoS patterns. If the problem still isn't solved, we go down to the hardware level — and that's where it gets interesting.
The wiki describes (Cache pollution) how to quickly kill performance on an array traversal “on your fingers”; there's no general solution for such a case, but a fix for a specific one is given (special cache-control instructions, OS support or hardware support). Let's poke at it ourselves.
Cover image (found somewhere on the internet). All tests are on this configuration — AMD Ryzen 9 3900X 12-Core 3.80 GHz.
cache parameters
Show code
Cache size
  L1 Data 32 KiB (x12)
  L1 Instruction 32 KiB (x12)
  L2 Unified 512 KiB (x12)
  L3 Unified 16384 KiB (x4)
Cache associativity
  Level 1 cache size - 12 x 32 KB 8-way set associative caches
  Level 2 cache size - 12 x 512 KB 8-way set associative unified caches
  Level 3 cache size - 4 x 16 MB 16-way set associative shared caches
Cache latency
	4 (L1 cache)
  12 (L2 cache)
  40 (L3 cache)
Memory controllers (has anyone read the specs and errata for the memory controller of recent Intels?) and especially the organization of caches in a CPU are very specific even within one processor series, let alone families and different (red) vendors — so the best confirmation is a measurement on your own hardware.
This little study grew out of analysing architecture and working with containers and algorithms in several game engines (EA Unity, Dagor Engine, 4A Engine). The tests use C++14 std and EASTL (EA Standard Template Library).
Let's start with a simple test placing data that will directly stress the cache on linear access. For example, let's take the standard map, eastl::map, and a hand-written map built on a sorted array:
map / eastl::map / fastmap find (1M pairs)
Show code
constexpr u32 test_size = 1000000;

struct map_holder {
    std::map<int, int> test_map_std;
    eastl::map<int, int> test_map_eastl;
    fastmap<int, int> test_fastmap;

    map_holder() {
        for (int j=0; j < test_size; j++) {
            test_map_std.insert({j, j+1});
            test_map_eastl.insert({j, j+1});
            test_fastmap.insert({j, j+1});
        }
    }
};

static map_holder holder;

static void EAstlMapFind(benchmark::State& state) {
  for (auto _ : state) {
    for (int j = 0; j < state.range(1); ++j) {
      auto v = holder.test_map_eastl.find(j);
      benchmark::DoNotOptimize(v);
    }
  }
}
BENCHMARK(EAstlMapFind)->Args({1, test_size});

static void MapFind(benchmark::State& state) {
  for (auto _ : state) {
    for (int j = 0; j < state.range(1); ++j) {
      auto v = holder.test_map_std.find(j);
      benchmark::DoNotOptimize(v);
    }
  }
}
BENCHMARK(MapFind)->Args({1, test_size});

static void FastMapFind(benchmark::State& state) {
  for (auto _ : state) {
    for (int j = 0; j < state.range(1); ++j) {
      auto v = holder.test_fastmap.find(j);
      benchmark::DoNotOptimize(v);
    }
  }
}
BENCHMARK(FastMapFind)->Args({1, test_size});
We get the following result:
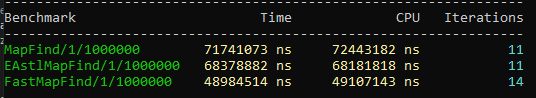
The test is simple and not representative, because there are a number of mistakes: fastmap is built on a sorted vector, while std/eastl::map are usually red–black trees. Let's rewrite it a bit to compare like with like, and get more comparable results.
map / unordered_map / eastl::map / fastmap find (1M pairs)
Show code
constexpr u32 test_size = 1000000;

struct map_holder {
    std::unordered_map<int, int> test_map_unordered;
    std::map<int, int> test_map_std;
    eastl::map<int, int> test_map_eastl;
    fastmap<int, int> test_fastmap;

    map_holder() {
        for (int j=0; j < test_size; j++) {
            test_map_unordered.insert({j, j+1});
            test_map_std.insert({j, j+1});
            test_map_eastl.insert({j, j+1});
            test_fastmap.insert({j, j+1});
        }
    }
};

static map_holder holder;

static void UnorderedMapFind(benchmark::State& state) {
  for (auto _ : state) {
    for (int j = 0; j < state.range(1); ++j) {
      auto v = holder.test_map_unordered.find(j);
      benchmark::DoNotOptimize(v);
    }
  }
}
BENCHMARK(UnorderedMapFind)->Args({1, test_size});

static void EAstlMapFind(benchmark::State& state) {
  for (auto _ : state) {
    for (int j = 0; j < state.range(1); ++j) {
      auto v = holder.test_map_eastl.find(j);
      benchmark::DoNotOptimize(v);
    }
  }
}
BENCHMARK(EAstlMapFind)->Args({1, test_size});

static void MapFind(benchmark::State& state) {
  // Code inside this loop is measured repeatedly
  for (auto _ : state) {
    for (int j = 0; j < state.range(1); ++j) {
      auto v = holder.test_map_std.find(j);
      benchmark::DoNotOptimize(v);
    }
  }
}
BENCHMARK(MapFind)->Args({1, test_size});

static void FastMapFind(benchmark::State& state) {
  for (auto _ : state) {
    for (int j = 0; j < state.range(1); ++j) {
      auto v = holder.test_fastmap.find(j);
      benchmark::DoNotOptimize(v);
    }
  }
}
BENCHMARK(FastMapFind)->Args({1, test_size});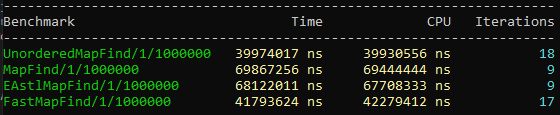
Better — representative timings on specific hardware, but the test isn't quite right: reads happen sequentially, i.e. we ourselves train the CPU's BPU that similar fetches will follow, and the stride between fetches is small. To get more reliable numbers we need to break the predictability.
A bit of theory: access time to main RAM is very high, so individual regions are duplicated in the cache, which greatly improves speed. This requires synchronization between cache levels and main memory, and raises the data-coherence problem.
Now, with this knowledge, let's rewrite the test to account for object size on access. The idea: say game entities lie in an array one after another; we know that if we put more data nearby, the CPU finds it easier to work with — it loads into cache and we don't have to go to RAM.
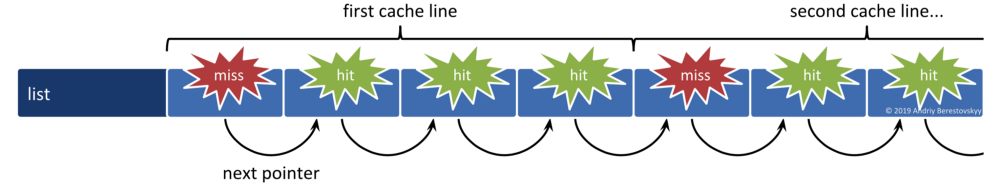
working with objects larger than or close to page size in an array (cache poisoning)
Show code
u32 constexpr operator"" _B(unsigned long long int n) { return n; }
u32 constexpr operator"" _KB(unsigned long long int n) { return n * 1024; }
u32 constexpr operator"" _MB(unsigned long long int n) { return n * 1000 * 1000; }

const u32 cache_line_size = 64_B;
const u32 page_size = 4_KB;

struct TestNode {
  TestNode *next = nullptr;
  char members[page_size];
};

static TestNode *find_last_node(TestNode *head, u32 num_ops) {
  while (num_ops--) head = head->next;
  return head;
}

static void cpu_cache_access(benchmark::State &state) {
  const auto mem_block_size = operator""_KB(state.range(0));
  const auto num_nodes = mem_block_size / cache_line_size;

  std::vector<TestNode> nodes(num_nodes);
  for (size_t i = 0; i < nodes.size() - 1; i++) nodes[i].next = &nodes[i + 1];
  nodes[nodes.size() - 1].next = &nodes[0];

  const u32 num_ops = 1_MB;
  while (state.KeepRunningBatch(num_ops)) {
    auto last_node = find_last_node(&nodes[0], num_ops);
    benchmark::DoNotOptimize(last_node);
  }

  state.counters["Nodes"] = benchmark::Counter(num_nodes, benchmark::Counter::kDefaults, benchmark::Counter::OneK::kIs1024);
  state.counters["Read Rate"] = benchmark::Counter( state.iterations() * cache_line_size, benchmark::Counter::kIsRate, benchmark::Counter::OneK::kIs1024);
}
BENCHMARK(cpu_cache_access)
    ->ArgName("KB")
    ->RangeMultiplier(2)
    ->Range(1, 2048)
    ->Range(4096, 16384)
    // L1 Cache
    ->DenseRange(1, 8, 1)
    // L2 Cache
    ->DenseRange(48, 160, 16)
    // L3 Cache
    ->DenseRange(512, 4096, 512);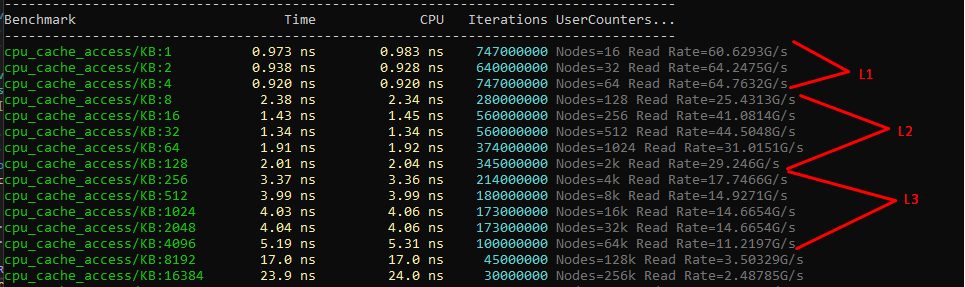
Going beyond the L3 cache leads to truly dismal results, with access time over 20 ns per element. Playing a bit with the benchmark parameters, you can gather stats and draw a nice graph of access time vs element size in the array.
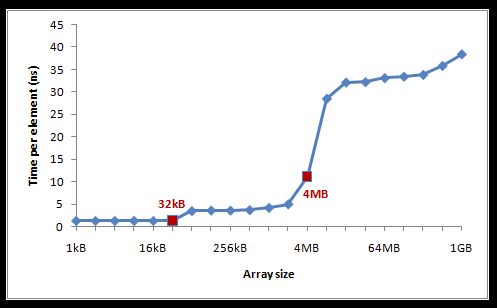
The picture is old (2015), but the results are similar to current ones and representative. A practical example: traversing an array of objects 65 KB each. Say we found a solution that works faster with such an array and implemented it in the tests. In the tests everything is fine, but in the real app the gain is barely a couple of percent.
Why did that happen? Let's dig further into why the benchmark shows a good gain while the real app gets a couple of percent at best. If you run the tests in sterile conditions — close the browser, mail, the IDE — results repeat from run to run with minimal variation, but… nobody works like that.
I won't circle around the cause for long: in my case Chrome + Visual Studio + Slack strongly affected the test results, and the worst was with Slack running. What Slack does to the cache I don't know, but turning it off makes the results better. That app's ~5% influence on the tests…
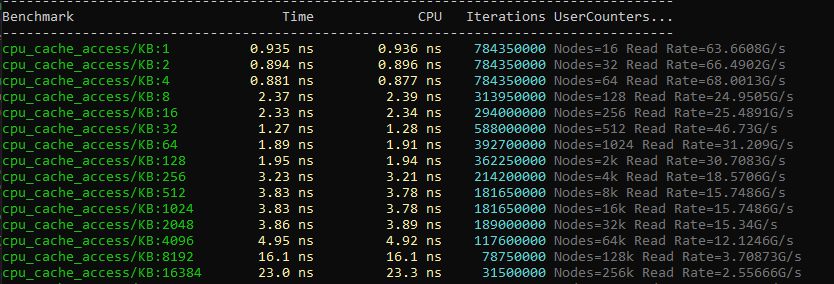
Tests with Slack unloaded.
Approaching cache limits (associativity)
There's a simple matrix-transpose task, or some other simple task requiring iteration over an array. We lose performance if two or more cache lines compete for access to a region of memory (recall, the cache is just a mapping of RAM).
The example is synthetic, made to show the architecture's limits — but if the object size approaches one where cache-associativity effects appear (and we usually pack objects into arrays for convenience, right?), it will increasingly affect work with them.
matrix transpose (critical stride)
Show code
int transpose(int *mat, int size)
{
   for ( int i = 0 ; i < size ; i++ )
   for ( int j = 0 ; j < size ; j++ )
   {
       int ij = i * size + j;
       int ji = j * size + i;
       int aux = mat[ij];
       mat[ij] = mat[ji];
       mat[ji] = aux;
   }
   return 0;
}

static void TransposeMatrix(benchmark::State& state) {
  const int msize = state.range(0);
  std::vector<int> matv;
  matv.resize(msize * msize);
  int *mat = matv.data();
  for ( int i = 0 ; i < msize ; i++ )
  for ( int j = 0 ; j < msize ; j++ )
     mat[i * msize + j] = i+j;

  for (auto _ : state) {
    benchmark::DoNotOptimize(transpose((int*)mat, msize));
  }
}
BENCHMARK(TransposeMatrix)
    ->DenseRange(63, 68, 1)
    ->DenseRange(125, 129, 1)
    ->DenseRange(254, 257, 1)
    ->DenseRange(510, 514, 1)
    ->DenseRange(1022, 1026, 1);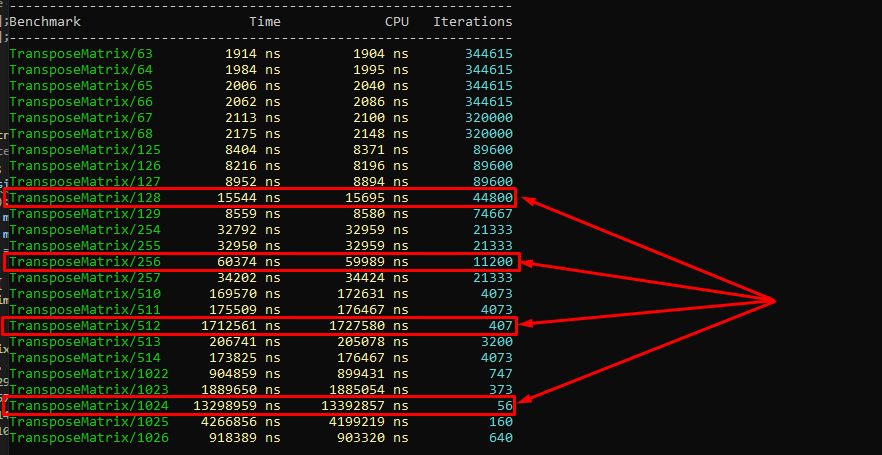
Example of matrices that are awkward to process in cache.
Cache data coherence
If more than one core (in different threads) works with some data, those values must be synchronized between caches. It depends on the architecture, but usually each core has its own L1, cores share L2 (one per two or four), and there's an L3 shared by all cores.
thread-local variable (iterations = 500M)
Show code
struct NonAtomicVariable {
  void RunThread() {
    volatile int64_t counter = 0;
    for (auto i = 0; i < iterations; ++i) {
      ++counter;
    }
  }
};

NonAtomicVariable: numThreads = 1 ... 224 ms
NonAtomicVariable: numThreads = 2 ... 236 ms
NonAtomicVariable: numThreads = 3 ... 245 ms
NonAtomicVariable: numThreads = 4 ... 201 ms
NonAtomicVariable: numThreads = 5 ... 185 ms
NonAtomicVariable: numThreads = 6 ... 198 ms
NonAtomicVariable: numThreads = 7 ... 175 ms
NonAtomicVariable: numThreads = 8 ... 204 ms
NonAtomicVariable: numThreads = 9 ... 227 ms
NonAtomicVariable: numThreads = 10 ... 201 ms
We got some time (200 ms), remembered it; all threads performed roughly the same. Let's complicate the example and ask the compiler to note that the data in memory is shared and can be changed at any moment.
shared variable between threads (iterations = 500M)
Show code
volatile int64_t _counter;
struct NonAtomicShared {
public:
  void RunThread() {
    for (auto i = 0; i < iterations; ++i) {
      ++_counter;
    }
  }
};

NonAtomicShared: numThreads = 1 ... 235 ms
NonAtomicShared: numThreads = 2 ... 2381 ms
NonAtomicShared: numThreads = 3 ... 3548 ms
NonAtomicShared: numThreads = 4 ... 4957 ms
NonAtomicShared: numThreads = 5 ... 6332 ms
NonAtomicShared: numThreads = 6 ... 7522 ms
NonAtomicShared: numThreads = 7 ... 8806 ms
NonAtomicShared: numThreads = 8 ... 10183 ms
NonAtomicShared: numThreads = 9 ... 11500 ms
NonAtomicShared: numThreads = 10 ... 12787 ms
Why such a critical performance drop — any change to the variable in any thread flushes the whole cache line in all other cores and fetches its current state from memory. More threads, more changes, more overhead. In the end, on 10 threads they just “stand around” constantly exchanging the line state.
atomic variable (lock on a memory region)
Show code
std::atomic_int64_t _counter;
struct AtomicVariable {
  void RunThread() noexcept override {
    for (auto i = 0; i < Iterations; ++i) {
      _counter.fetch_add(1, Order);
    }
  }
};

AtomicVariable(relaxed): numThreads = 1 ... 2002 ms
AtomicVariable(relaxed): numThreads = 2 ... 2018 ms
AtomicVariable(relaxed): numThreads = 3 ... 2028 ms
AtomicVariable(relaxed): numThreads = 4 ... 2029 ms
AtomicVariable(relaxed): numThreads = 5 ... 2048 ms
AtomicVariable(relaxed): numThreads = 6 ... 2054 ms
AtomicVariable(relaxed): numThreads = 7 ... 2075 ms
AtomicVariable(relaxed): numThreads = 8 ... 2077 ms
AtomicVariable(relaxed): numThreads = 9 ... 2099 ms
AtomicVariable(relaxed): numThreads = 10 ... 2108 ms
A practical application is a spinlock for working with resources. Take the Test-And-Set implementation — it's simple and fairly fast, but that simplicity hides a catch: with many threads and intensive cache interaction we get a slowdown.
Test-And-Set spinlock (simple)
Show code
namespace this_thread {
    int cmpxchg(volatile int& v, int exc, int cmp) { return _InterlockedCompareExchange((unsigned long*)&v, exc, cmp);  }
  	int load(volatile int* v) { return *v;  }
}

struct	tas_spin_lock {
	enum	{ SPINLOCK_FREE	= 0, SPINLOCK_FREE = -1 };
	volatile int		_lock;

	void	lock	() 	{
		while (this_thread::cmpxchg(_lock, SPINLOCK_FREE, SPINLOCK_FREE))
			_mm_pause();
	}

	void	unlock	()	 {
		_lock			= SPINLOCK_FREE;
	}

	tas_spin_lock()  : _lock(SPINLOCK_FREE) {}
};
The probability that the resource (in our case the spinlock) is freed on the next attempt is 1 / (core × ht) = 1 / (12 × 2) = 1 / 24 (for my CPU).
Actually much lower, because I took ideal app conditions. You can raise this by an order or two if you account for:
context-switch costs;
idle time of other threads;
other factors.
So for a notional 240–2400 cycles the CPU just polls the cache emptily, each time taking a lock on that memory region. Now let's rewrite the spinlock so that after checking the variable it leaves it alone for a while, letting other consumers finish with the resource. This lowers overall contention.
Test-Test-And-Set spinlock (backoff wait)
Show code
struct    ttas_spin_lock {
    enum    { SPINLOCK_FREE    = 0, SPINLOCK_TAKEN    = -1 };
    volatile int        _lock;

    void    lock    () {
        for (;;) {
            // Optimistically assume the lock is free on the first try
            if (!this_thread::cmpxchg(_lock, SPINLOCK_TAKEN, SPINLOCK_FREE)) {
                break;
            }

            // Wait for lock to be released without generating cache annoying
            uint8_t wait = 1;
            while (SPINLOCK_FREE != this_thread::load(&_lock)) {
                wait *= 2; // exponential backoff if can't get lock
                for (uint8_t i = 0; i < wait; i++)
                    _mm_pause();
            }
        }
    }
    void    unlock    () {
        _lock = SPINLOCK_FREE;
    }

    spin_lock() : _lock(SPINLOCK_FREE) {}
};
The total execution time of each thread dropped from 2 seconds to 0.3 seconds. The test is the same as the shared atomic variable, but the approach to working with it was changed — a "random" wait was added after updating the variable.
Show code
SpinLock(TAS impl):
numThreads = 1 ... 1.802 s
numThreads = 2 ... 1.908 s
numThreads = 3 ... 1.738 s
numThreads = 4 ... 1.829 s
numThreads = 5 ... 1.949 s
numThreads = 6 ... 2.154 s
numThreads = 7 ... 1.785 s
numThreads = 8 ... 1.767 s
numThreads = 9 ... 1.990 s
numThreads = 10 ... 2.208 s

SpinLock(T-TAS impl):
numThreads = 1 ... 0.1690 s
numThreads = 2 ... 0.2000 s
numThreads = 3 ... 0.5880 s
numThreads = 4 ... 0.3110 s
numThreads = 5 ... 0.1680 s
numThreads = 6 ... 0.1570 s
numThreads = 7 ... 0.2960 s
numThreads = 8 ... 0.5710 s
numThreads = 9 ... 0.1870 s
numThreads = 10 ... 0.1610 s
And finally, about data alignment
A performance test you can easily do yourself: add an option to pack data without alignment and move the tested data over a wide enough address range so it touches the edges of cache lines.
unaligned access and results (over 10% loss)
Show code
#pragma pack(1)
struct my_packed_struct_s {
    uint8_t byte1;
    uint32_t val1;
    uint8_t byte2;
    uint32_t val2;
};
#pragma pack()

static void Test00(benchmark::State& state) {
  int steps = 16 * 1024;
  int offset = state.range(0);

  char *x1 = new char[16 * 1024 * 1024];
  my_packed_struct_s *non_packed_s = new my_packed_struct_s[16 * 1024 * 1024];

  for (auto _ : state) {
    for (int i = 0; i < steps; i++) {
        non_packed_s[i].byte2 = x1[i];
        benchmark::DoNotOptimize(non_packed_s);
    }
  }
}
BENCHMARK(Test00)->DenseRange(0, 64, 8);

struct auto_packed_struct_s {
    uint8_t byte1;
    uint32_t val1;
    uint8_t byte2;
    uint32_t val2;
};

static void Test01(benchmark::State& state) {
  int steps = 16 * 1024;
  int offset = state.range(0);

  char *x2 = new char[16 * 1024 * 1024];
  auto_packed_struct_s *auto_packed_s = new auto_packed_struct_s[16 * 1024 * 1024];

  for (auto _ : state) {
    for (int i = 0; i < steps; i++)
    {
        auto_packed_s[i].byte2 = x2[i];
        benchmark::DoNotOptimize(auto_packed_s);
    }
  }
}
BENCHMARK(Test01)->DenseRange(0, 64, 8);
Show code
// данные не выровнены, меньше -> лучше
Test00/0        23685 ns        23542 ns        29867
Test00/8        22759 ns        22496 ns        29867
Test00/16       22717 ns        22496 ns        29867
Test00/24       22770 ns        22949 ns        32000
Test00/32       22649 ns        22461 ns        32000
Test00/40       22809 ns        22496 ns        29867
Test00/48       22728 ns        22496 ns        29867
Test00/56       22676 ns        22949 ns        32000
Test00/64       22785 ns        22949 ns        32000

// данные выровнены
Test01/0        19068 ns        19252 ns        37333
Test01/8        19050 ns        18834 ns        37333
Test01/16       18946 ns        18834 ns        37333
Test01/24       19147 ns        19252 ns        37333
Test01/32       19195 ns        19252 ns        37333
Test01/40       19037 ns        19252 ns        37333
Test01/48       18941 ns        19252 ns        37333
Test01/56       19011 ns        19252 ns        37333
Test01/64       19001 ns        18589 ns        36462
Almost all modern architectures suffer from unaligned access (e.g. reading at address 0x1001), and it strongly reduces performance. If you look at memcpy implementations in gcc (e.g. copying a 256 + 3-byte struct), the algorithm usually copies in chunks aligned to boundaries.
It can also happen that even reading two bytes at 0x1001 (vs aligned 0x0FFC) with cache misses leads to reading two lines, where 0x1001 is one cache line with data at its end and the next byte falls on the next line. So effectively out of 128 cached bytes we use only a fraction.
Instead of conclusions:
I deliberately didn't write about automatic, hardware and manual cache prefetching — that topic is much broader and has its own “here be dragons”. It's hard to cover properly, accessibly and with examples in a single article.
Everything added to boost performance — wider data buses, pipelines, caches, branch prediction, multiple execution cores and HT — helps a lot, but everything has weak spots that can be exploited, intentionally or by accident. Compilers or libraries can mask them, but not always.
And it would be a bigger mistake to think the bottleneck is the CPU rather than the algorithm you wrote. How you feed the CPU data determines the speed of everything: you can have a good algorithm that stumbles over the cache or alignment and ends up as efficient as bubble-sort.
The book “Algorithms and Data Structures” in a modern edition should be renamed “Data Structures and Algorithms” — in order of priority/importance. Niklaus Wirth's book is here: link.
Thanks for reading — may your solutions be bug-free.
P.S. After writing the article I searched for similar ones on Habr: one and two, plus C# examples. In short, the problems haven't gone anywhere — same ones, same places…
← All articles