
I always wanted to write about something light and airy, the way @antoshkka writes about userver, for example, or about how easily and casually you can wrap some thingy algorithm in a dozen templates, pour std::optional all over it, and, sipping coffee, wait for the compiler to deign to chew through it all. But fate (and not the team lead, no, how could you think that) keeps tossing me tasks where the debugger's harsh embrace won't let a programmer's dreamy soul go until late at night, and the eternal fight with the compiler ruins every attempt to wrap the result of the thingy algorithm in another dozen templates. This time, one clear June morning, fate tossed me an amusing task — the full bundle build time was creeping toward two hours, and building bundles these days is not the fastest pleasure. But looking at the stats, it became clear that ~55% of the time goes on building resources: textures, models, localization and so on. There's plenty to fix there, but that's the realm of the build engineers. Another 30%, or forty minutes, goes on tests — now everything we've gathered and re-converted has to be checked, loaded, shot at, run around, monsters killed, behavior trees exercised; let QA deal with that. And in the remaining 15%, or about 15 minutes, we did the "real work," building the heart of the project — the binary. "It's fine, it's always like that for us, even on an empty UE project," said our mobile guys and went off to drink coffee on the terrace. But we're not mobile guys, we're serious AAA folks, we have our own engine and a custom pipeline on the build farm. And besides, 15 minutes is still a lot, even if you have 27k files in the project. Let's go see where the time went.
The cunning team lead
But first I took these questions to the architect and the tech lead. 15 minutes — that's really a lot. The tech lead was no help, because milestone and gotta-ship-features anyway, and from the architect there were only questions like "Is the repo on an SSD?", "Did you try a RAM disk?", "And what about [insert your own thing here]?" And yes, in principle he's right, and no, I didn't test any of it, because I couldn't be bothered to fiddle with a new gadget, and because my home pet of 2.5k files builds from scratch in 35±5 seconds. Extrapolating that data — 27k should build in about 35 × 10 = 6 minutes. And anyway, the project old-timers said that a few years ago the project built in 3 minutes, and there weren't all that many fewer files back then.
15 minutes 32 seconds (Fixing the parasite)
You could probably try blaming "fat" templates, compilers, slow computers or the Moon being in the wrong phase. But the simplest way to find out what the main problem is — is not to immediately launch your favorite profiler (procmon, vcperf, clang-trace — pick your own) or to run some insane scientific tests, like I do. To start with, it's enough to just look at the processes with the heaviest load and their CPU time.
So before opening vcperf, I decided to peek into Task Manager, and I see a very strange picture there: the studio is hogging 17% of CPU time, plus the browser, the antivirus and explorer. Something's off here — why on earth are all these comrades even showing up?

Never mind the old studio — the project is run through several compilers.
Chrome. OK, a browser is a known devourer of everything it can reach, but there's nothing to be done here: either documentation and kittens, or compilation time — fine, let it live. Note that this is all still very unscientific; I'm just going on the assumption that the fewer other processes there are, the more time the compiler gets.
Explorer?! What are you even doing here, explorer? Well, first of all, it's not just a tool for managing files and folders, it's also the shell. If you kick it, the desktop, the Start menu and basically everything else disappear. You can only blame the ham-fisted folks who wrote it that way. Secondly, our build spun up a separate console window where it threw all sorts of stuff during the build from the studio's pipe, and where other analysis tools could hook in — for example, an assert collector or other internal build-progress warnings. And, judging by ProcessExplorer, the console is also managed through explorer. But that's not the cause: simply turning off that console gave us a gain of about 15s. Yes, 15s is a lot, but it's clearly not the cause.
Visual Studio?! Sweetheart, you were supposed to grab 100% of the resources and compile-compile-compile.
Aaaaand... I'm done compiliiiiiing!
> Build succeeded.
>    0 Error(s)
> Time Elapsed 00:15:32.530
Antimalware Service Executable, the antivirus, and like any antivirus, it's going to take a serious look at what we're doing — and there we are fooling around, churning through 27k files and creating another 60k or so object files and temporary tmp files. Looks like the valiant DevOps forgot to add the repo to the exclusion list. Let's fix that oversight. Result: we got about a 10% speedup of the overall compile time. It was 15:32, became 14:12. Nice, but clearly not the silver bullet, though a small victory.
> Build succeeded.
>    0 Error(s)
> Time Elapsed 00:14:12.240
OK, nothing else seems to be getting in the dancer's way, but the compile time is still 14 minutes. We open vcperf and look at where the time goes — and it goes on compiling and parsing headers. That's where the idea came from to look at how much time exactly we spend processing each file. The test bed for subsequent changes was a working project, with the goal of making the build time as small as possible. Maybe some time is spent launching the compiler, but let's not dig into that point. Since we have a fairly large code base, the dependencies we found helped reduce the build time quite well.
! Sorry, I had to paint over the paths. The community manager wouldn't let it through :(
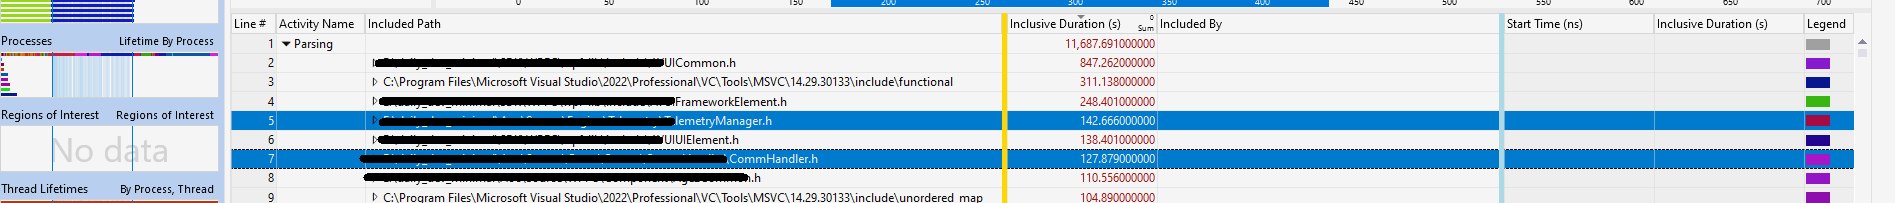
The result of this work was a set of tests and, as the result, a summary table of header build times. I try to avoid generalizing the results, because these tests were run on a single machine with a single specific goal. So I'll post the raw data for comparison across several MS and Clang (Sony PS5) compilers. This lets you see the dependencies in the results and, I hope, will be interesting to most readers.
Results by compiler
Header processing time, in seconds:
Header              VS17    VS19    clang (16.0)
algorithm           0.169   0.191   0.316
array               0.184   0.253   0.106
atomic              0.326   0.405   0.659
bitset              0.329   0.415   0.527
cassert             0.010   0.009   0.017
chrono              0.144   0.195   0.306
climits             0.010   0.009   0.018
cmath               0.036   0.045   0.084
condition_variable  0.286   0.372   0.510
cstdint             0.011   0.009   0.018
cstdio              0.143   0.143   0.173
deque               0.183   0.216   0.439
filesystem          0.383   0.516   0.289
forward_list        0.183   0.214   0.338
fstream             1.271   1.331   1.476
functional          0.287   0.222   0.561
future              1.059   1.317   2.474
initializer_list    0.011   0.013   0.022
ios                 0.259   0.318   0.456
iosfwd              0.080   0.094   0.172
iostream            2.264   2.325   3.464
istream             1.264   1.324   1.463
iterator            0.265   0.327   0.468
list                0.183   0.214   0.338
map                 0.194   0.231   0.863
memory              0.173   0.200   0.324
mutex               0.280   0.364   0.598
ostream             1.261   1.321   0.459
queue               0.198   0.235   0.374
random              0.305   0.394   0.553
regex               2.392   1.505   1.634
set                 0.185   0.217   0.341
sstream             0.329   0.416   0.528
stack               0.186   0.216   0.341
string              0.327   0.413   0.523
thread              0.227   0.289   0.448
tuple               0.123   0.163   0.263
type_traits         0.043   0.060   0.096
typeinfo            0.051   0.068   0.107
unordered_map       0.204   0.445   0.184
utility             0.098   0.127   0.212
vector              0.285   0.217   0.244
windows.h           4.423   4.517   7.038
You've probably noticed that most of the headers that are heavy to compile (except windows.h and iostream) — and they really are heavy if the time to process them is more than 100 ms — are templates.
Header      VS17    VS19    clang
algorithm   0.169   0.191   0.316
array       0.184   0.253   0.106
atomic      0.326   0.405   0.659
bitset      0.329   0.415   0.527
iterator    0.265   0.327   0.468
vector      0.285   0.217   0.244
Templates are one of my most beloved C++ features, letting me write the way I want, not the way the standard demands. Just kidding! But, darn it, why are they so slow? What's in array that makes it compile for 200 ms — it's just a wrapper over an array. A header with templates can be included only once, but the implementation is compiled for every combination of arguments for every compilation unit. And expensive templates can significantly increase compile time, which is exactly what we got. Maybe there are some issues with instantiation, placing memory on the stack, various checks. Or take vector — also seemingly nothing complicated, but again 200-plus ms on all compilers.
I looked on godbolt (/d1reportTime, example; clang unfortunately can't do this) at how long the compilation of each vector function takes:
std::vector<int>::_Construct_n:        0.000566s
std::vector<int>::vector:              0.000564s
std::vector<int>::_Tidy:               0.000341s
std::vector<int>::_Buy_raw:            0.000262s
std::_Compressed_pair<...>::_Compressed_pair: 0.000248s
std::vector<int>::max_size:            0.000244s
std::_Vector_const_iterator<...>:      0.000295s
std::_Vector_iterator<...>:            0.000184s
std::_Vector_val<...>:                 0.000096s
std::vector<T, Alloc>:                 0.001980s
std::vector<int>:                      0.002384s
  std::allocator_traits<std::allocator<int>>:        0.000518s
    std::_Default_allocator_traits<...>:            0.000451s
      std::allocator<int>:                          0.000265s
  std::_Compressed_pair<...>:                       0.000274s
    std::_Vector_val<std::_Simple_types<int>>:      0.000145s
      std::_Simple_types<int>:                      0.000035s
...
∑ vector: 0.326898s
These are tiny times. They're not even all that important, right? Who cares about compiling std::vector<>::max_size -> 0.000169s if it takes two tenths of a millisecond? It's so insignificant it's not worth worrying about…
14 minutes 12 seconds (Tormenting the templates)
> Build succeeded.
>    0 Error(s)
> Time Elapsed 00:14:12.240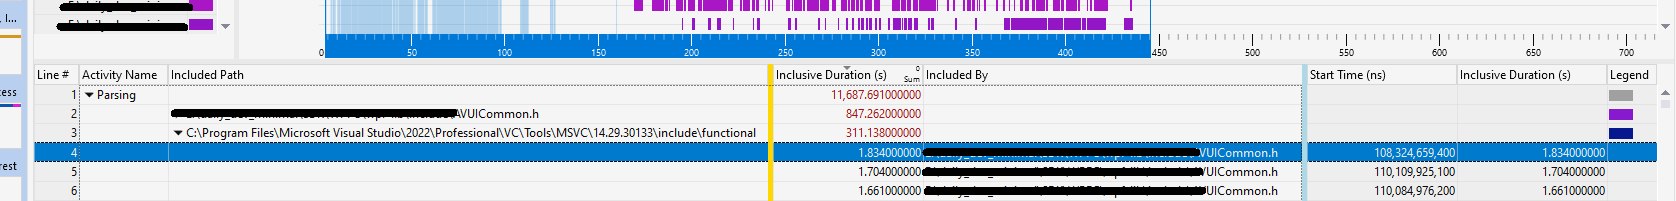
It is worth worrying if you have 27k files in the project. 27k × 0.326 = 8,880 seconds — almost three hours :) Good thing we don't use vector in every file. 14 minutes, granted, isn't three hours, but it's also a lot, so let's see how to reduce that time. The cost of using a template consists of two things: the time to parse the #include header file and the time to instantiate the template for a given type. When a compilation unit (a .cpp file) is processed, the preprocessor loads every header file it finds in the #include directives of that file and of all subsequent headers. Header files usually have include guards to prevent re-loading, so each header is usually loaded only once (usually, because you can still catch a hidden recursion).
Unlike non-template code, every instantiation, access, and even a pointer to a template class requires compiling all of its used and dereferenced members. VS lets you treat this rule more loosely, but clang requires instantiating the whole template, not just parts of it.
In the case of a large include hierarchy — for example, mega-headers — this can mean hundreds (HUNDREDS!) of unique vector types in a single compilation unit. There's no salvation here: even the fact that only the things actually used get compiled lets you trim the time by percentages, but not by multiples. So if, say, the std::vector::push_back method is never called and never compiled, it will still be parsed by the compiler every time and prepared for compilation. And why? Here's why! It was done to speed up builds: if such a method is already in the compiler's cache, then preparing it takes less time. And the folks at MS and clang jointly decided: let's put all the methods we come across into the cache ahead of time, maybe they'll be needed.
If 50 different vector template types are used, then the cost of compiling these templates is paid 50 times. And that's only for one translation unit; the next translation unit pays for all of it again. !Profit. Let's try to fix this.
Forward Declaration
Where possible, you should use forward declarations. This eliminates including the header file and the cost of compiling the template for a specific type. Doing nothing is the best optimization I can recommend. Templates can be forward-declared, but then the template must be declared in the header only through a pointer or reference, and must never be dereferenced. The template parameter types must also be either forward-declared or fully defined.
Sometimes you need to figure out what exactly is taking the time. The VS compiler's /d1reportTime flag helps here; in tests I sometimes had to compile one line at a time with minimal changes and record the time the compiler needed, and then think about why this or that change leads to a growth in compile time. Se la vi, as they say ¯\_(ツ)_/¯. It was funny, of course, to hunt for fleas, but here's an example:
void vector<_TYPE_>::preallocate(const size_t count) {
  if (count > m_capacity) {                              // 0.000023s
    _TYPE_ * const data = static_cast<_TYPE_*>
                       (malloc(sizeof(_TYPE_) * count));  // 0.000076s
    const size_t end = m_size;                            // 0.000028s
    m_size = std::min(m_size, count);                     // 0.000402s
    for (size_t i = 0; i < count; i++) {                  // 0.000042s
       new (&data[i]) _TYPE_(std::move(m_data[i]));       // 0.000148s
    }
Notice anything unusual? And what about this?
void vector<_TYPE_>::preallocate(const size_t count) {
  if (count > m_capacity) {                              // 0.000023s
    _TYPE_ * const data = static_cast<_TYPE_*>
                       (malloc(sizeof(_TYPE_) * count));  // 0.000076s
    const size_t end = m_size;                            // 0.000028s
    if ( count < m_size ) { m_size = count; }             // 0.000012s
    for (size_t i = 0; i < count; i++) {                  // 0.000042s
       new (&data[i]) _TYPE_(std::move(m_data[i]));       // 0.000148s
    }
Template redundancy
There's quite a lot of duplication in templates, but that's exactly why it's called a template: by adding redundancy in one file, we remove it everywhere else and pay for it with compile time. Every time a template is instantiated with a new type, all the used members are compiled anew, with the single difference being a different type. Constructor, destructor, copy, move operations — but the rest of the code stays identical. And the more methods the class has, the more expensive the template instantiation is. And if template functions of a template class show up on top of that, time starts flying into space! Every empty template function costs about 0.000030 seconds to compile, and that's before any code is added to it. By placing a call to one template function inside another, we greatly increase compile time, and it changes very non-linearly.
It's important to understand here that although optimizing template functions can lead to small improvements, it won't always be the best solution, because the very nature of templates leads to significant compilation costs due to the many unique instantiations. In this case you need to look for ways to minimize the number of instantiations or to reduce the number of template functions the compiler has to process.
Dependency analysis and pulling apart the header hierarchies saved three minutes; the project's build time became 11:25. All this work, pushing these tasks through the task tracker, took a couple of months of working time: the project is big, you can't fix everything at once, plus you have to coordinate your changes with other teams. But the results were visible, so we decided to continue this work.

11 minutes 25 seconds (Preparing precompiled headers)
> Build succeeded.
>    0 Error(s)
> Time Elapsed 00:11:25.210
About include guards I think you all know, otherwise you wouldn't have come to read this article :)
Further pulling apart of headers no longer gave significant results — ±5 seconds to the build time doesn't count. If you noticed, in the previous screenshot functional was in many of the file includes. That means it's time for the project to start using PCH. This optimization was enabled for most projects, but for some parts of it it was deliberately disabled. Since I wasn't allowed into that code, I couldn't get much of a gain there, but nonetheless we saved a minute on the existing config.
How PCH works
In general terms, a PCH is created by compiling a source file (*.cpp) using compiler-specific flags. When the header files from the include hierarchy are processed, they go through the preprocessor as usual, but their binary result is saved to disk. When this PCH is used in another file, its representation is loaded, which lets you skip many processing steps and save time.
The advantage of PCH is that it lets you significantly speed up compile time, especially when the same header files are included many times in different translation units. For example, if you frequently use the standard headers or system libraries, precompiling those files into a PCH can save substantial time.

The downside of PCH is that it's a fairly expensive operation, which often takes much more time than the benefits it brings. Every change in any of the header files included in the PCH triggers its rebuild. The second non-obvious downside: if you include too many headers, the purely physical particulars of working with files start to matter — in the screenshot below our shared PCH file topped 4 GB. I don't know what the studio does to produce such sizes, but loading that much became simply slow and ate up all the benefits. In the end we had to split the projects and give each its own separate PCH file. Along the way we managed to clean up the PCH configs themselves and reduce their size to 1 GB each, which saved another minute or so.
10 minutes 13 seconds (Simplifying dependencies)
> Build succeeded.
>    0 Error(s)
> Time Elapsed 00:10:13.410
The more header files are included, the longer compilation takes. A header that includes everything under the sun starts to slow down everything around you. The system headers ran out, and we started looking at the compile time of the engine's and the game's files. One of the solutions was to use global headers that declare the main types being used. This let us not only simplify the internal header hierarchy but also substantially refactor the dependencies between modules, which were what led to the chaotic includes. And along the way to find the problem with including windows.h in some files, from where it crept across the whole project and increased compile time. Getting rid of the over-coupling in the object hierarchy and of the windows.h include saved another 40 seconds or so.
9 minutes 31 seconds (Reviving PIMPL)
> Build succeeded.
>    0 Error(s)
> Time Elapsed 00:09:31.350
In C++ it's not hard to get access to a class's private members (here), even though they're hidden from external code. The compiler only makes access to them slightly harder, yet external code sometimes needs to know about the private variables — for example, to determine an object's size and alignment. Classes often include private functions and data, even though they're actually not needed in the header, or are even harmful and drag in other headers. If data or functions are used only in the implementation, you can make them visible only within that module, which brings several advantages:
- less work for the preprocessor — minimizing headers;
- reduced linking time — fewer symbols in the global symbol tables.
The PIMPL method (Pointer to Implementation) helps hide data and functionality, reducing changes in the public header files, which in turn reduces compile time. This approach helps "close off" the implementation details from the outside world, but has its downsides in the form of extra memory-allocation cost and pointer indirection. But in certain implementations, where perf isn't the top priority, we can afford to untangle dependencies where forward declaration doesn't manage it. It didn't turn out super pretty, but it saved another 20 seconds. The solution was controversial, so we decided not to develop it further.
9 minutes 12 seconds (Turning off the analyzers)
> Build succeeded.
>    0 Error(s)
> Time Elapsed 00:09:12.130
This is a terrible suggestion, don't do it! But if compile time really bothers you, turn off code analysis. Analysis significantly slows down the build… veeery much. In our case it took almost a minute and a half. Don't do this on your own projects without weighty reasons. Correct code is code that has been checked with everything you possibly can: a compilation matrix, a dozen analyzers and a couple of wise leads. Incorrect code is everything else — fast, but useless and full of bugs. In the end we solved this at the organizational level: PRs were run without the code analyzer, and if a PR compiled fine and passed the minimal tests, it went into dev, while the build farm ran a second identical one but with analysis enabled.
7 minutes 34 seconds (Turning off the unit tests)
> Build succeeded.
>    0 Error(s)
> Time Elapsed 00:07:34.440
And here we've come down to almost 7 minutes — that's a good compile time for a large project of almost thirty thousand files. Analyzing the time that was spent on compilation, it became clear that our test block, which had grown since the last game update and by then reached almost 3k different checks, takes almost a minute to build. These tests aren't needed in the everyday build, and an ordinary developer never ran them, yet they cost time. So we did the same with them as with code analysis — moved them into a separate step on the build farm after the PR run.
6 minutes 22 seconds (Turning off LTO)
> Build succeeded.
>    0 Error(s)
> Time Elapsed 00:06:22.240
Link Time Optimization (LTO) is an optimization technology performed at the application's linking stage. The compiler can optimize code at the level of a single file, but with LTO the compiler analyzes the whole program at once. This lets it eliminate unused functions, lay out the call order more efficiently and minimize overhead. LTO is divided into full LTO (Full LTO) and Thin LTO. Thin LTO is a variant designed specifically to speed up linking large projects: the whole project is split into several parts and optimization is done in parallel within each. LTO significantly increases compile time; in our case it took a minute and a bit for ThinLTO, almost two minutes for Full. Full LTO, per the benchmarks, gave about a 4% gain, ThinLTO about 3%; we kept full only for QA builds, and enabled the faster one for everyone else. That's another minute off the build.
5 minutes 16 seconds (Finish)
> Build succeeded.
>    0 Error(s)
> Time Elapsed 00:05:16.740
So the final build time is five minutes and a bit — I think it turned out pretty well. Not everything, of course, could be solved by changes in the project alone, but five minutes is five minutes: a cup of coffee with a croissant, not a can of beer with a sandwich. In general, as usual, we slowly invented problems for ourselves and then bravely fixed them.

P.S.
Compiler Diagnostic. For Microsoft Visual Studio there are flags that provide information of varying usefulness:
/Bt+— reports the compile time of the compiler's front and back parts for each file. C1XX.dll is the front part of the compiler, responsible for compiling source code into an intermediate language (IL). The compile time at this stage usually depends on the preprocessor's runtime (includes, templates, etc.). C2.dll is the back part of the compiler, which generates object files (turns IL into machine code)./d1reportTime— reports the runtime of the compiler's front part, available only in Visual Studio 2017 Community or newer. (Thanks to @phyronnaz and @aras_p.)/d2cgsummary— reports functions that have "anomalous" compile times. It's useful, give it a try.
Combining these flags in Visual Studio gives a lot of information about where compile time goes. For clang there's the -ftime-report flag; I recommend checking out this post — it's quite old, but fundamentally nothing has changed.
If you have additions or suggestions — write in the comments. Don't suggest ccache/RAM disk: expensive, lots of hassle and little payoff.
Thanks for reading!
← All articles